Forum Replies Created
-
AuthorPosts
-
 Merav YuravlivkerKeymaster
Hi Natasha,
Thanks for your post! Data is the correct answer – I looked over the answer as well, and data should be marked as correct:
“A ggplot graph has several components, starting with the data. This is flipped from some other graphing systems you may have used, where the first component is the type of the finished graph — bar chart or line graph or whatever. With the grammar of graphics, you start with the data and describe how to get from the columns to layered geometric components.”
Please let me know if there’s anything else I can help you with!
Best,
Merav
Merav YuravlivkerKeymasterHi Selina,
Thank you for your post – it looks like the scatterplot3js has been updated so that it only accepts matrices as the data input (you can view this documentation by entering
?scatterplot3js). This means that we need to putas.matrixin front of the subsetted data, and close it with an extra parenthesis:scatterplot3js(as.matrix(subset(house_votes_color_Dem, select = c("aye", "nay", "other"))), # renderer = "canvas", # <- makes the points round color = house_votes_color_Dem$color, flip.y = FALSE, # <- makes the y-axis go from small # to large values starting from # the x-axis labels = house_votes_color_Dem$Last.Name) # <- shows the # Rep's name # when you # scroll overYou’ll notice that I also commented out the ‘renderer’ argument, as it seems to have been temporarily disabled by the creator of this package. When you run this code, the chart should appear. Please let me know if that works!
Best,
Merav
Merav YuravlivkerKeymasterHi Claudia,
Thank you for your post – would you be able to paste the error that you’re getting? That way, we will be able to better understand what the issue is. Much appreciated!
Best,
Merav
Merav YuravlivkerKeymasterHi Claudia,
Thank you for your post! It sounds like the .csv files are located in a file that is different than the working directory that R uses to find files.
The best way to fix this is to set your working directory to the folder with all of the datasets you need. I believe there is a Master data folder that should contain all the datasets you need for the course. You can set the working directory by either coding
setwd("your file path")or by clicking on “Session > Set Working Directory > Choose Directory…”, and then finding the folder with the datasets you need.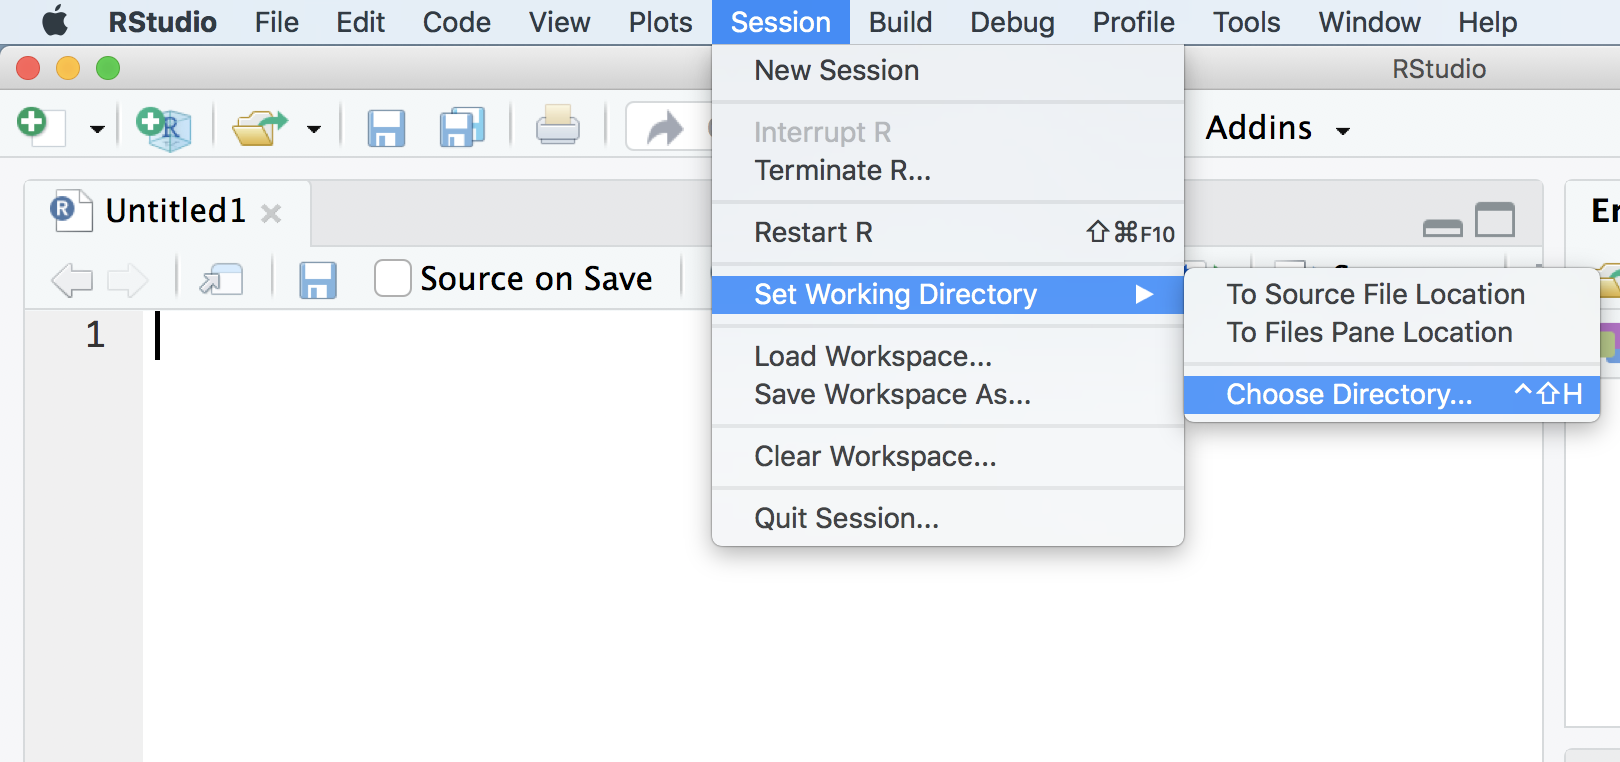
You should be able to see the file path at the top of the “Console” window in gray letters to check that you set it correctly. Please let me know if that helps!
Best,
Merav
Merav YuravlivkerKeymasterHi Javier,
Thank you for your message – it looks like the plyr package has already been installed. Once it has been installed once, you can comment out the
install.packages("plyr")line (you can put a # in front of it so R ignores it).While you will need to load the package every time with the
library(plyr)line, you do not need to run the install.packages line after you do it the first time.Best,
Merav
Merav YuravlivkerKeymasterHi Natasha,
Thank you for your question – clustering is the unsupervised machine learning technique that finds new patterns in data that were previously undiscovered. I believe the intention of the answer is to specify that it is not based on previous discovered patterns, which is supervised machine learning.
I can understand why the phrasing may have been unclear, so I will look over this question and adjust the language to make sure that it alleviates any confusion in the future.
Please let me know if you have any additional questions!
Best,
Merav
Merav YuravlivkerKeymasterHi Claudia,
Thank you for reaching out – I had noticed the same issue, and I have reached out to RStudio to ask about alternatives or the reasoning behind the functionality being removed.
In the the meantime, you can use the “read.csv” function to import the CSV dataset – you have to set your working directory to where the dataset is, and then type in the dataset name in quotation marks. For example, if I wanted to import the “crime_incidents_2013_location.csv” data set, I would set the directory to the folder that it is in, and then type:
read.csv("crime_incidents_2013_location.csv")Please let me know if you have any additional questions!
Best,
Merav
Merav YuravlivkerKeymasterHi Jose! Thank you for your post – are you still able to see the map, even with these errors? These errors typically appear when the data points are outside of the mapped area. So, in order to make the errors disappear, you can zoom out of the map more so it includes all the data points.
Please let me know if that helps!
Best,
MeravMerav YuravlivkerKeymasterHi Natasha,
You should be able to access them by downloading the materials and exercises in the course – you can find the buttons on the right-hand side of the lesson pages. Please let me know if you’re unable to find them.
Best,
Merav
February 15, 2018 at 5:05 pm EST in reply to: Importing datasets with new Version of R Studio #26881Merav YuravlivkerKeymasterHi Natasha,
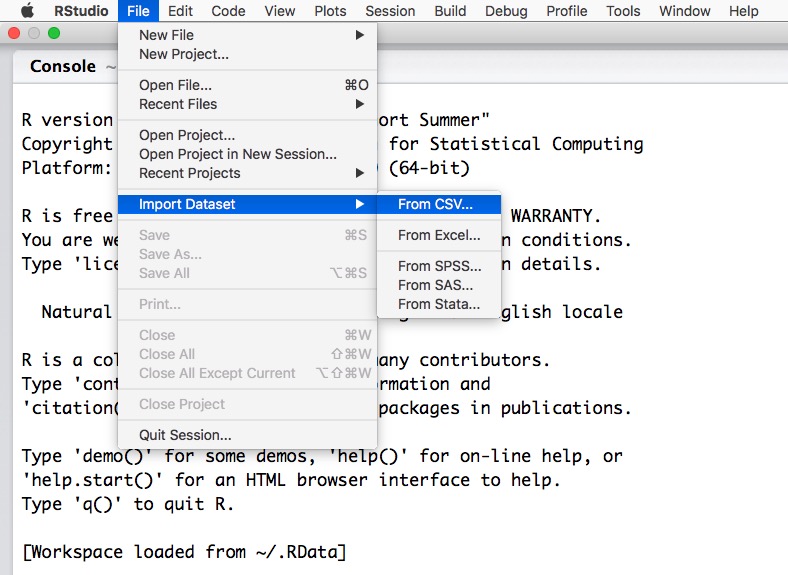
Thank you for your question – you are right, RStudio has changed its interface. The new way to import datasets is through the File menu > Import Dataset > Import as CSV
Please let me know if you have any additional questions!
Best,
Merav
Merav YuravlivkerKeymasterHi Cameron,
Glad to hear it! I have heard that you may need to load an older version of ggplot2 or make sure that R and RStudio are up to date, as there was a bug in a previous version.
Please let me know if you have any more questions!
Best,
Merav
Merav YuravlivkerKeymasterHi Kisha,
Thank you for letting us know, we are working with our developers to try to remove the feedback score from the overall assessment. Will keep you updated when we have more information!
Best,
Merav
Merav YuravlivkerKeymasterHi Kisha,
Thank you for your question! The salary data set comes with the ‘car’ package. Once you load the package, you can type in
View(Salaries)and the data set should come up.‘# For this exercise, we will be working with a data set named “Salaries” that comes
# with R. The main objective of this exercise is to quantify the effect of years
# in service on salary.# 1. Start by setting your working directory, and load the data set “car”, which is
# required for this exercise.
setwd(“directory path”)
install.packages(“car”)
library(car)’Best,
Merav
Merav YuravlivkerKeymasterHi Latoya,
Thank you so much for the feedback. We will adjust the fill-in-the-blank answers to properly reflect all forms of English spelling!
Best,
Merav
Merav YuravlivkerKeymasterHi Subhanga,
Thank you for your message, and apologies for the delay in response. In the new version, you can actually import data from the File menu – go to File -> Import Dataset -> Import CSV…
That should fix the issue! Please let me know if you have any additional questions.
Best,
Merav
-
AuthorPosts


