Forum Replies Created
-
AuthorPosts
-
 Merav YuravlivkerKeymaster
Hi Elizabeth,
Thank you for your question! So here is the code for the graph I think you’re trying to create (from slide 65):
ggplot(house_votes_Dem, aes(x = yea,
                            y = nay,
                            color = party_labels_Dem,  #<- tell R how to color
                            #   the data points
                            shape = party_clusters_Dem)) +
  geom_point(size = 6) +
  ggtitle("Aye vs. Nay votes for Democrat-introduced bills") +
  xlab("Number of Aye Votes") +
  ylab("Number of Nay Votes") +
  scale_shape_manual(name = "Cluster",
                     labels = c("Cluster 1", "Cluster 2"),
                     values = c("1", "2")) +
  scale_color_manual(name = "Party",         #<- tell R which colors to use and
                     #   which labels to include in the legend
                     labels = c("Democratic", "Republican"),
                     values = c("blue", "red")) +
  theme_light()
There are a few things you may notice here. The first is that there is a ‘color’ argument in the aes() layer at the beginning of the code, which will allow the graph to color particular points. So make sure to include that in your aesthetics layer. The second aspect I wanted to point out is that your scale_shape_manual is telling R to use the letters ‘b’ and ‘r’ (in the values argument) as the shape. I think you want to use the values of 1 and 2 to get those two shapes to correspond to the cluster labels of 1 and 2. You can then add the scale_color_manual() argument to specify the colors you want for the two different political parties.
Ggplot2 can always be a bit tough to get the hang of – I always like to think of ggplot2 as a graph with layers on it. So the aesthetics layer is the bottom layer that defines the data we want on there, and then we add layers on it like the labels, shapes, colors, legends, etc.
Please let me know if this helps!
Best,
Merav
Merav YuravlivkerKeymasterHi Elizabeth!
Thanks for your comment – when we’re talking about ordering in this case, it’s grouping all the categories in state.region together so we can do a quick check on how each region is performing as a whole. In terms of the extra comma at the end, that is to specify that the order() function is being applied to the rows of the data frame, not the columns. Whenever we use square brackets in code, the first argument applies to the rows, and the second argument applies to columns.
If we didn’t have that comma in there, R wouldn’t know how to apply the order() function and you’d get this error:
“Error in
[.data.frame(state.pop, order(state.pop$state.region, decreasing = F)) :
undefined columns selected”Commas are always a bit tricky when you first start coding (and even more experienced coders can forget these things!), the best advice I have for that is to think about how the syntax is structured and what information R needs to know in order to execute functions correctly. The more you practice, the more intuitive that knowledge will become. Another quick trick is to read code from the inside out so you’re taking it one function at a time instead of trying to read it left to right. That can help you avoid misplacing commas or parentheses.
Please let me know if you have any more questions and keep up the good work!
Best,
MeravMerav YuravlivkerKeymasterHi Elizabeth,
That may make sense – you can also try restarting R and RStudio, and then rerunning your code. I’ve found that solves my coding problems a lot of the time. Since you just downloaded R and RStudio, they should be up to date, but you can always check by going to the CRAN-R and RStudio websites to make sure.
Let me know if the issue is resolved!
Best,
MeravMerav YuravlivkerKeymasterHi Damaine,
Thanks for your question! There are a few things that I’m seeing here to be aware of:
1. Make sure that when you use the concatenate function, you use the lowercase c, so the function should be c() instead of C().
2. When you have numbers in the c() function, make sure to always separate them with a comma – so it should look like c(13, -10, -3, 48). This way, R understands that those four numbers are all separate numbers.
3. The question is asking you to use the abs() function, which is the absolute function. It is asking you to use it on a variable you should have already defined – so it should look like abs(U). Then, the question is asking you to assign it to the variable V. The final answer should look like this:
V = abs(U)
Please let me know if that helps!
Best,
Merav
Merav YuravlivkerKeymasterHi Elizabeth!
No bother at all, that’s what we’re here for! A few things I’m seeing here:
1. You don’t need to put the + signs if your code is on a different line within a function. The comma lets R know that to continue processing the code within the same function. We use the + signs when we work with adding attributes to visualizations, which you’ll see later in the course.
2. This error pops up when the dataset is not a data frame – try using the function data.frame(state.x77df) to make sure that it’s read in as a data frame.
3. Double check that the columns you’re naming in your code are the correct column names. If there’s a space in the column name, you can’t use regular quotation marks, you have to use the apostrophe mark that’s on the tilde (~) key, which is usually in the upper left hand corner of the keyboard.
Let me know if any of those suggestions work!
Best,
MeravMerav YuravlivkerKeymasterHi Elizabeth,
Thanks for your message! I noticed that you labeled the data set as UScereal2, but in the script, it’s UScereal_2. First thing I would do is check the variable to make sure you labeled it correctly. The second aspect I’d look into is make sure that the structure of the data set is numeric. Use the function str() to make sure that the columns are numeric like so:
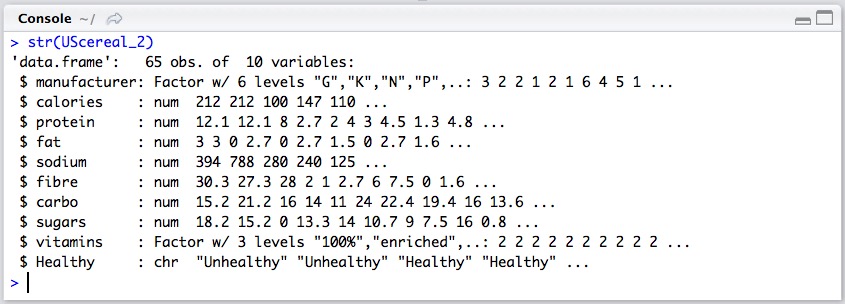
If neither of those steps resolve the problem, I recommend restarting R and RStudio, that tends to fix a lot of these issues. Please let me know if that helped solve the problem!
Best,
Merav
Merav YuravlivkerKeymasterHi Ernesto,
Thank you for your message – that error usually pops up when R can’t find the file. This usually means that the directory isn’t set or that the file isn’t in the folder.
There are two good solutions: one is to go to the File menu > Import Dataset > From CSV and find it on your computer and import it directly. The other is to go to the Session menu > Set Working Directory > Choose Directory and choose the folder where the file is.
R will look for files where you tell it to look so it’s always important to make sure you’re giving it the right path! Let me know if that helps 🙂
Best,
MeravFebruary 12, 2017 at 11:52 am EST in reply to: Excersize 9.8 – removing columns with -c("x", "y" etc) why doesn't this work #19189Merav YuravlivkerKeymasterHi Erik,
Thank you for your question! It looks like one of your columns has a space in the column title – “HS Grad”. When there is a space in the title, you can’t actually use quotation marks for it. Rather you need to use the apostrophe that’s below the tilde key on the upper left corner of your keyboard (to the left of the 1). The title should look like this:
HS Grad. I believe that right now, it’s not working because R is trying to read it as a variable, as opposed to a column.A quick short cut is to start to type out the column name, and RStudio should try to autofill it. Let me know if that helps!
Best,
Merav
Merav YuravlivkerKeymasterHi Kisha,
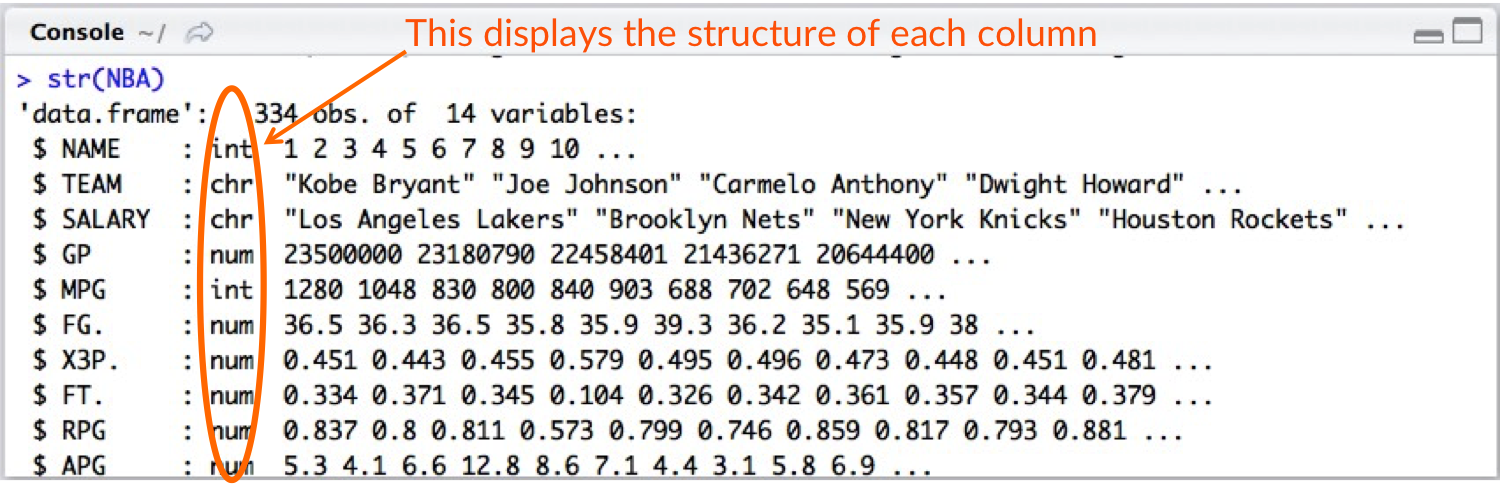
Thank you for your message! I have found the issue here – it turns out that the first column of the NBA.csv data set is not necessary and is a column of old row numbers. What that means is that every row is shifted over one to the right, so that the column names don’t match the data. I’ll update this data set right now in the materials folder, but in the meantime, you can open the NBA.csv in Excel and simply delete that first column from rows 2-335 and shift the cells over to the left. That should make all the columns match up with the right column names. Save the csv and try to import it again. That should solve the problem!
In terms of best practices, when you see a warning that says that the argument is not numeric or logical, it usually means that the structure of that column is not in the correct format for the function. For example, because all the columns were shifted over one, the SALARY column actually had names as opposed to numbers. You can always use the str() function – str(NBA) – to look at the structure of all the columns to see whether or not it is numeric or a different structure. More often than not, these types of errors are due to the structure of the data, and can be corrected with a simple as.integer() or as.numeric() function (remember for this function to use the dataset$column notation to point the function to adjust particular column).
In terms of the error with dplyr not being found, just double check to make sure that the plyr package is loaded – library(plyr) – as the dplyr function is part of that package. If you’ve restarted RStudio since you’ve last run the code, that’s probably what happened. A neat trick for this is to type two question marks followed by the function you want to use (i.e. ??plyr ). A help menu should appear in the bottom right corner that will show you the package that the function is a part of, and then you can load that particular package.
Please let me know if that helped and if you have any more questions!
Merav YuravlivkerKeymasterHi Ernesto,
Thank you for letting us know about this issue – I have just sent you an email with additional information, and we should have this problem resolved shortly.
Best,
MeravFebruary 2, 2017 at 9:37 am EST in reply to: Copying and Pasting Tables from Script into RStudio #19132Merav YuravlivkerKeymasterHi Chris!
Apologies for the delayed response, this somehow slipped through my notifications. It sounds like you were referring Exercise 4, Working with matrices – the easiest way to create this table would be to copy and paste the numbers into the code that you will write to make this into a variable. Once you’ve created it once, you can also make it into a data frame with the data.frame() function, and then save it as a csv file with write.csv() to be able to reuse it for future exercises and practice.
Please let me know if you have any additional questions!
Best,
MeravMerav YuravlivkerKeymasterAlways glad to help 🙂
February 2, 2017 at 9:29 am EST in reply to: ggplot2 unable to load / use in R-studio Version 1.0.136 #19130Merav YuravlivkerKeymasterHi Erik,
Thank you for reaching out! This seems to be an issue that relates to updating packages and R. First think I would do is to check the version of R that you currently have – when you open RStudio, the top of the console window should have information about it:
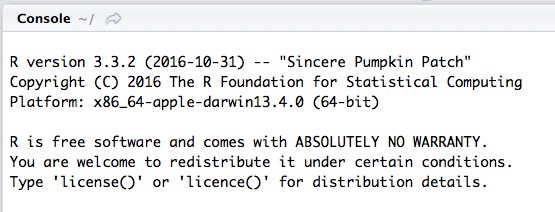
As of this posting, the latest version of R is 3.3.2, so if you don’t have the latest one, you can go to https://cran.r-project.org/ and download it for your operating system.
Another good check is to make sure that all your packages are updated. You can do that from the “Packages” window on the lower right-hand side of RStudio – simply click on the green “Update” button to update all the packages:
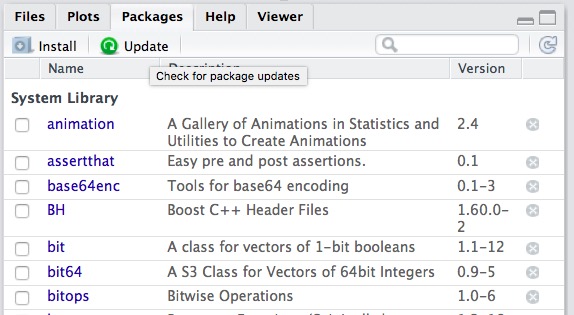
Once you do all of that and restart RStudio, check to see if ggplot2 will install cleanly. If you’re still getting the same error, try installing the lazyeval package – install.packages(‘lazyeval’) – before trying to install ggplot2 again.
Let me know if that helped!
Best,
MeravP.S. You’re not doing anything wrong! In fact, this type of troubleshooting and problem solving is what makes great coders and analysts 🙂
Merav YuravlivkerKeymasterHi Erik,
Thank you for your question! If I’m understanding your question correctly, you are looking for the R script that you see in the Manipulating Data lesson – the code is located in the “Introduction to R and Visualization course materials” folder, which you can download from the “Materials” button in the right-hand gray sidebar.
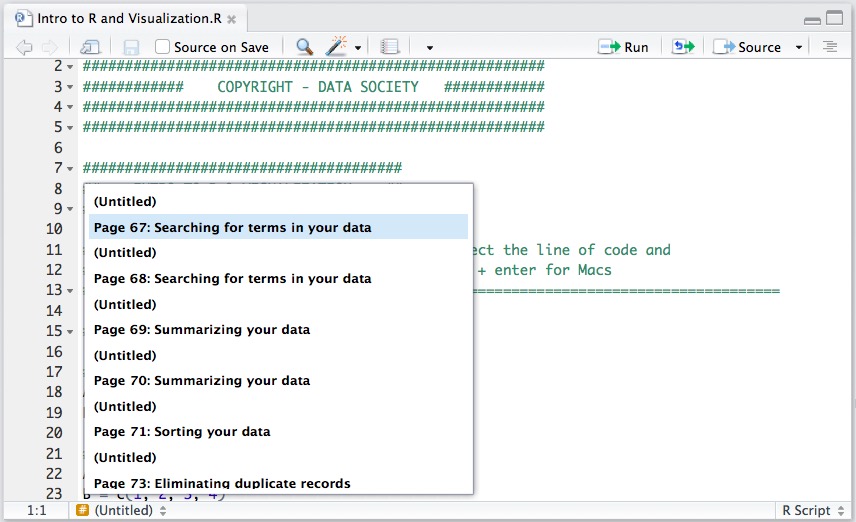
Once you’ve downloaded the folder, you should have an “Intro to R and Visualization.R” script – a neat feature of RStudio is that you can open up a “table of contents” when you click on the left title at the bottom gray bar of the script window and scroll to the script you want to see. If you know what slide it is on, it is easy to jump to that portion of the script.
Please let me know if that answers your question!
Best,
MeravMerav YuravlivkerKeymasterHi Hoang,
Yes, you are correct on the difference between multivariate and multi linear regression – we’ll be updating our materials to reflect this soon. Thank you very much for bringing this to our attention!
Best,
Merav -
AuthorPosts


