All questions
All questions
Quiz Summary
0 of 1443 questions completed
Questions:
Information
You have already completed the quiz before. Hence you can not start it again.
Quiz is loading…
You must sign in or sign up to start the quiz.
You must first complete the following:
Results
Results
0 of 1443 questions answered correctly
Your time:
Time has elapsed
You have reached 0 of 0 point(s), (0)
Earned Point(s): 0 of 0, (0)
0 Essay(s) Pending (Possible Point(s): 0)
Categories
- Not categorized 0%
- Basic statistics 0%
- Business data science 0%
- Classification concept 0%
- Classification in R 0%
- Clustering concept 0%
- Clustering in Excel 0%
- Clustering in R 0%
- Data cleaning in Excel 0%
- Data manipulation in Excel 0%
- Data visualization 0%
- Data wrangling in R 0%
- Formula optimization in Excel 0%
- Interactive visualizations 0%
- Intro data science concept 0%
- Intro data visualization in R 0%
- Intro Excel 0%
- Intro R programming 0%
- Intro SQL programming 0%
- k-means clustering in R 0%
- Network analysis concept 0%
- Regression concept 0%
- Regression in R 0%
- Text mining concept 0%
- Text mining in R 0%
- Time series analysis concept 0%
- 1
- 2
- 3
- 4
- 5
- 6
- 7
- 8
- 9
- 10
- 11
- 12
- 13
- 14
- 15
- 16
- 17
- 18
- 19
- 20
- 21
- 22
- 23
- 24
- 25
- 26
- 27
- 28
- 29
- 30
- 31
- 32
- 33
- 34
- 35
- 36
- 37
- 38
- 39
- 40
- 41
- 42
- 43
- 44
- 45
- 46
- 47
- 48
- 49
- 50
- 51
- 52
- 53
- 54
- 55
- 56
- 57
- 58
- 59
- 60
- 61
- 62
- 63
- 64
- 65
- 66
- 67
- 68
- 69
- 70
- 71
- 72
- 73
- 74
- 75
- 76
- 77
- 78
- 79
- 80
- 81
- 82
- 83
- 84
- 85
- 86
- 87
- 88
- 89
- 90
- 91
- 92
- 93
- 94
- 95
- 96
- 97
- 98
- 99
- 100
- 101
- 102
- 103
- 104
- 105
- 106
- 107
- 108
- 109
- 110
- 111
- 112
- 113
- 114
- 115
- 116
- 117
- 118
- 119
- 120
- 121
- 122
- 123
- 124
- 125
- 126
- 127
- 128
- 129
- 130
- 131
- 132
- 133
- 134
- 135
- 136
- 137
- 138
- 139
- 140
- 141
- 142
- 143
- 144
- 145
- 146
- 147
- 148
- 149
- 150
- 151
- 152
- 153
- 154
- 155
- 156
- 157
- 158
- 159
- 160
- 161
- 162
- 163
- 164
- 165
- 166
- 167
- 168
- 169
- 170
- 171
- 172
- 173
- 174
- 175
- 176
- 177
- 178
- 179
- 180
- 181
- 182
- 183
- 184
- 185
- 186
- 187
- 188
- 189
- 190
- 191
- 192
- 193
- 194
- 195
- 196
- 197
- 198
- 199
- 200
- 201
- 202
- 203
- 204
- 205
- 206
- 207
- 208
- 209
- 210
- 211
- 212
- 213
- 214
- 215
- 216
- 217
- 218
- 219
- 220
- 221
- 222
- 223
- 224
- 225
- 226
- 227
- 228
- 229
- 230
- 231
- 232
- 233
- 234
- 235
- 236
- 237
- 238
- 239
- 240
- 241
- 242
- 243
- 244
- 245
- 246
- 247
- 248
- 249
- 250
- 251
- 252
- 253
- 254
- 255
- 256
- 257
- 258
- 259
- 260
- 261
- 262
- 263
- 264
- 265
- 266
- 267
- 268
- 269
- 270
- 271
- 272
- 273
- 274
- 275
- 276
- 277
- 278
- 279
- 280
- 281
- 282
- 283
- 284
- 285
- 286
- 287
- 288
- 289
- 290
- 291
- 292
- 293
- 294
- 295
- 296
- 297
- 298
- 299
- 300
- 301
- 302
- 303
- 304
- 305
- 306
- 307
- 308
- 309
- 310
- 311
- 312
- 313
- 314
- 315
- 316
- 317
- 318
- 319
- 320
- 321
- 322
- 323
- 324
- 325
- 326
- 327
- 328
- 329
- 330
- 331
- 332
- 333
- 334
- 335
- 336
- 337
- 338
- 339
- 340
- 341
- 342
- 343
- 344
- 345
- 346
- 347
- 348
- 349
- 350
- 351
- 352
- 353
- 354
- 355
- 356
- 357
- 358
- 359
- 360
- 361
- 362
- 363
- 364
- 365
- 366
- 367
- 368
- 369
- 370
- 371
- 372
- 373
- 374
- 375
- 376
- 377
- 378
- 379
- 380
- 381
- 382
- 383
- 384
- 385
- 386
- 387
- 388
- 389
- 390
- 391
- 392
- 393
- 394
- 395
- 396
- 397
- 398
- 399
- 400
- 401
- 402
- 403
- 404
- 405
- 406
- 407
- 408
- 409
- 410
- 411
- 412
- 413
- 414
- 415
- 416
- 417
- 418
- 419
- 420
- 421
- 422
- 423
- 424
- 425
- 426
- 427
- 428
- 429
- 430
- 431
- 432
- 433
- 434
- 435
- 436
- 437
- 438
- 439
- 440
- 441
- 442
- 443
- 444
- 445
- 446
- 447
- 448
- 449
- 450
- 451
- 452
- 453
- 454
- 455
- 456
- 457
- 458
- 459
- 460
- 461
- 462
- 463
- 464
- 465
- 466
- 467
- 468
- 469
- 470
- 471
- 472
- 473
- 474
- 475
- 476
- 477
- 478
- 479
- 480
- 481
- 482
- 483
- 484
- 485
- 486
- 487
- 488
- 489
- 490
- 491
- 492
- 493
- 494
- 495
- 496
- 497
- 498
- 499
- 500
- 501
- 502
- 503
- 504
- 505
- 506
- 507
- 508
- 509
- 510
- 511
- 512
- 513
- 514
- 515
- 516
- 517
- 518
- 519
- 520
- 521
- 522
- 523
- 524
- 525
- 526
- 527
- 528
- 529
- 530
- 531
- 532
- 533
- 534
- 535
- 536
- 537
- 538
- 539
- 540
- 541
- 542
- 543
- 544
- 545
- 546
- 547
- 548
- 549
- 550
- 551
- 552
- 553
- 554
- 555
- 556
- 557
- 558
- 559
- 560
- 561
- 562
- 563
- 564
- 565
- 566
- 567
- 568
- 569
- 570
- 571
- 572
- 573
- 574
- 575
- 576
- 577
- 578
- 579
- 580
- 581
- 582
- 583
- 584
- 585
- 586
- 587
- 588
- 589
- 590
- 591
- 592
- 593
- 594
- 595
- 596
- 597
- 598
- 599
- 600
- 601
- 602
- 603
- 604
- 605
- 606
- 607
- 608
- 609
- 610
- 611
- 612
- 613
- 614
- 615
- 616
- 617
- 618
- 619
- 620
- 621
- 622
- 623
- 624
- 625
- 626
- 627
- 628
- 629
- 630
- 631
- 632
- 633
- 634
- 635
- 636
- 637
- 638
- 639
- 640
- 641
- 642
- 643
- 644
- 645
- 646
- 647
- 648
- 649
- 650
- 651
- 652
- 653
- 654
- 655
- 656
- 657
- 658
- 659
- 660
- 661
- 662
- 663
- 664
- 665
- 666
- 667
- 668
- 669
- 670
- 671
- 672
- 673
- 674
- 675
- 676
- 677
- 678
- 679
- 680
- 681
- 682
- 683
- 684
- 685
- 686
- 687
- 688
- 689
- 690
- 691
- 692
- 693
- 694
- 695
- 696
- 697
- 698
- 699
- 700
- 701
- 702
- 703
- 704
- 705
- 706
- 707
- 708
- 709
- 710
- 711
- 712
- 713
- 714
- 715
- 716
- 717
- 718
- 719
- 720
- 721
- 722
- 723
- 724
- 725
- 726
- 727
- 728
- 729
- 730
- 731
- 732
- 733
- 734
- 735
- 736
- 737
- 738
- 739
- 740
- 741
- 742
- 743
- 744
- 745
- 746
- 747
- 748
- 749
- 750
- 751
- 752
- 753
- 754
- 755
- 756
- 757
- 758
- 759
- 760
- 761
- 762
- 763
- 764
- 765
- 766
- 767
- 768
- 769
- 770
- 771
- 772
- 773
- 774
- 775
- 776
- 777
- 778
- 779
- 780
- 781
- 782
- 783
- 784
- 785
- 786
- 787
- 788
- 789
- 790
- 791
- 792
- 793
- 794
- 795
- 796
- 797
- 798
- 799
- 800
- 801
- 802
- 803
- 804
- 805
- 806
- 807
- 808
- 809
- 810
- 811
- 812
- 813
- 814
- 815
- 816
- 817
- 818
- 819
- 820
- 821
- 822
- 823
- 824
- 825
- 826
- 827
- 828
- 829
- 830
- 831
- 832
- 833
- 834
- 835
- 836
- 837
- 838
- 839
- 840
- 841
- 842
- 843
- 844
- 845
- 846
- 847
- 848
- 849
- 850
- 851
- 852
- 853
- 854
- 855
- 856
- 857
- 858
- 859
- 860
- 861
- 862
- 863
- 864
- 865
- 866
- 867
- 868
- 869
- 870
- 871
- 872
- 873
- 874
- 875
- 876
- 877
- 878
- 879
- 880
- 881
- 882
- 883
- 884
- 885
- 886
- 887
- 888
- 889
- 890
- 891
- 892
- 893
- 894
- 895
- 896
- 897
- 898
- 899
- 900
- 901
- 902
- 903
- 904
- 905
- 906
- 907
- 908
- 909
- 910
- 911
- 912
- 913
- 914
- 915
- 916
- 917
- 918
- 919
- 920
- 921
- 922
- 923
- 924
- 925
- 926
- 927
- 928
- 929
- 930
- 931
- 932
- 933
- 934
- 935
- 936
- 937
- 938
- 939
- 940
- 941
- 942
- 943
- 944
- 945
- 946
- 947
- 948
- 949
- 950
- 951
- 952
- 953
- 954
- 955
- 956
- 957
- 958
- 959
- 960
- 961
- 962
- 963
- 964
- 965
- 966
- 967
- 968
- 969
- 970
- 971
- 972
- 973
- 974
- 975
- 976
- 977
- 978
- 979
- 980
- 981
- 982
- 983
- 984
- 985
- 986
- 987
- 988
- 989
- 990
- 991
- 992
- 993
- 994
- 995
- 996
- 997
- 998
- 999
- 1000
- 1001
- 1002
- 1003
- 1004
- 1005
- 1006
- 1007
- 1008
- 1009
- 1010
- 1011
- 1012
- 1013
- 1014
- 1015
- 1016
- 1017
- 1018
- 1019
- 1020
- 1021
- 1022
- 1023
- 1024
- 1025
- 1026
- 1027
- 1028
- 1029
- 1030
- 1031
- 1032
- 1033
- 1034
- 1035
- 1036
- 1037
- 1038
- 1039
- 1040
- 1041
- 1042
- 1043
- 1044
- 1045
- 1046
- 1047
- 1048
- 1049
- 1050
- 1051
- 1052
- 1053
- 1054
- 1055
- 1056
- 1057
- 1058
- 1059
- 1060
- 1061
- 1062
- 1063
- 1064
- 1065
- 1066
- 1067
- 1068
- 1069
- 1070
- 1071
- 1072
- 1073
- 1074
- 1075
- 1076
- 1077
- 1078
- 1079
- 1080
- 1081
- 1082
- 1083
- 1084
- 1085
- 1086
- 1087
- 1088
- 1089
- 1090
- 1091
- 1092
- 1093
- 1094
- 1095
- 1096
- 1097
- 1098
- 1099
- 1100
- 1101
- 1102
- 1103
- 1104
- 1105
- 1106
- 1107
- 1108
- 1109
- 1110
- 1111
- 1112
- 1113
- 1114
- 1115
- 1116
- 1117
- 1118
- 1119
- 1120
- 1121
- 1122
- 1123
- 1124
- 1125
- 1126
- 1127
- 1128
- 1129
- 1130
- 1131
- 1132
- 1133
- 1134
- 1135
- 1136
- 1137
- 1138
- 1139
- 1140
- 1141
- 1142
- 1143
- 1144
- 1145
- 1146
- 1147
- 1148
- 1149
- 1150
- 1151
- 1152
- 1153
- 1154
- 1155
- 1156
- 1157
- 1158
- 1159
- 1160
- 1161
- 1162
- 1163
- 1164
- 1165
- 1166
- 1167
- 1168
- 1169
- 1170
- 1171
- 1172
- 1173
- 1174
- 1175
- 1176
- 1177
- 1178
- 1179
- 1180
- 1181
- 1182
- 1183
- 1184
- 1185
- 1186
- 1187
- 1188
- 1189
- 1190
- 1191
- 1192
- 1193
- 1194
- 1195
- 1196
- 1197
- 1198
- 1199
- 1200
- 1201
- 1202
- 1203
- 1204
- 1205
- 1206
- 1207
- 1208
- 1209
- 1210
- 1211
- 1212
- 1213
- 1214
- 1215
- 1216
- 1217
- 1218
- 1219
- 1220
- 1221
- 1222
- 1223
- 1224
- 1225
- 1226
- 1227
- 1228
- 1229
- 1230
- 1231
- 1232
- 1233
- 1234
- 1235
- 1236
- 1237
- 1238
- 1239
- 1240
- 1241
- 1242
- 1243
- 1244
- 1245
- 1246
- 1247
- 1248
- 1249
- 1250
- 1251
- 1252
- 1253
- 1254
- 1255
- 1256
- 1257
- 1258
- 1259
- 1260
- 1261
- 1262
- 1263
- 1264
- 1265
- 1266
- 1267
- 1268
- 1269
- 1270
- 1271
- 1272
- 1273
- 1274
- 1275
- 1276
- 1277
- 1278
- 1279
- 1280
- 1281
- 1282
- 1283
- 1284
- 1285
- 1286
- 1287
- 1288
- 1289
- 1290
- 1291
- 1292
- 1293
- 1294
- 1295
- 1296
- 1297
- 1298
- 1299
- 1300
- 1301
- 1302
- 1303
- 1304
- 1305
- 1306
- 1307
- 1308
- 1309
- 1310
- 1311
- 1312
- 1313
- 1314
- 1315
- 1316
- 1317
- 1318
- 1319
- 1320
- 1321
- 1322
- 1323
- 1324
- 1325
- 1326
- 1327
- 1328
- 1329
- 1330
- 1331
- 1332
- 1333
- 1334
- 1335
- 1336
- 1337
- 1338
- 1339
- 1340
- 1341
- 1342
- 1343
- 1344
- 1345
- 1346
- 1347
- 1348
- 1349
- 1350
- 1351
- 1352
- 1353
- 1354
- 1355
- 1356
- 1357
- 1358
- 1359
- 1360
- 1361
- 1362
- 1363
- 1364
- 1365
- 1366
- 1367
- 1368
- 1369
- 1370
- 1371
- 1372
- 1373
- 1374
- 1375
- 1376
- 1377
- 1378
- 1379
- 1380
- 1381
- 1382
- 1383
- 1384
- 1385
- 1386
- 1387
- 1388
- 1389
- 1390
- 1391
- 1392
- 1393
- 1394
- 1395
- 1396
- 1397
- 1398
- 1399
- 1400
- 1401
- 1402
- 1403
- 1404
- 1405
- 1406
- 1407
- 1408
- 1409
- 1410
- 1411
- 1412
- 1413
- 1414
- 1415
- 1416
- 1417
- 1418
- 1419
- 1420
- 1421
- 1422
- 1423
- 1424
- 1425
- 1426
- 1427
- 1428
- 1429
- 1430
- 1431
- 1432
- 1433
- 1434
- 1435
- 1436
- 1437
- 1438
- 1439
- 1440
- 1441
- 1442
- 1443
- Current
- Review
- Answered
- Correct
- Incorrect
-
Question 1 of 1443
1. Question
Why do we cluster the basketball data with 3 clusters after we analyze it with 2 clusters?
CorrectIncorrect -
Question 2 of 1443
2. Question
What does the Akaike Information Criterion (AIC) do?
Select all that applyCorrectIncorrect -
Question 3 of 1443
3. Question
Which standard delimiters can Excel identify to split text into multiple columns?
CorrectIncorrect -
Question 4 of 1443
4. Question
What is heteroscedasticity?
CorrectIncorrect -
Question 5 of 1443
5. Question
Where can you download the Excel Solver from?
CorrectIncorrect -
Question 6 of 1443
6. Question
What is one of the most effective methods for tuning an algorithm?
CorrectIncorrect -
Question 7 of 1443
7. Question
Which of the below statements are TRUE about n-fold cross validation?
CorrectIncorrect -
Question 8 of 1443
8. Question
What happened to the AUC when we ran a boosted random forest model after the initial random forest model?
CorrectIncorrect -
Question 9 of 1443
9. Question
Which of these is not an assumption of time series analysis?
CorrectIncorrect -
Question 10 of 1443
10. Question
Which of these statements is true?
CorrectIncorrect -
Question 11 of 1443
11. Question
Why do we see mostly zeroes in the term-document matrix that we created from the NYT articles?
CorrectIncorrect -
Question 12 of 1443
12. Question
1. In order to create interactive data visualizations, we will use:
CorrectIncorrect -
Question 13 of 1443
13. Question
1. Fill in the blank.
-
A connects points (nodes) by lines that represent relationships. By studying the interactions between people, places and events, you can determine how messages, ideas, and diseases spread and how a change in one thing can cause a cascading set of effects.
CorrectIncorrect -
-
Question 14 of 1443
14. Question
1. Fill in the blank below.
-
is the smoothing parameter you add to the base formula because it tells you how much of the error from a past time period to incorporate into your forecast for a future time period.
CorrectIncorrect -
-
Question 15 of 1443
15. Question
2. Identify the three things necessary to make a graph in ggplot2.
Select all that applyCorrectIncorrect -
Question 16 of 1443
16. Question
1. Which function tells Shiny to visualize a graph?
CorrectIncorrect -
Question 17 of 1443
17. Question
1. Which two variables showed the strongest correlations with two clusters?
Select all that applyCorrectIncorrect -
Question 18 of 1443
18. Question
1. Why might it be more challenging to do a sentiment analysis on communications between Millenials?
CorrectIncorrect -
Question 19 of 1443
19. Question
1. When using data you may encounter any of the challenges listed below. Match each challenge with its description.
Sort elements
- Having the right staff with the right skills
- Getting the right data, the right sample size, and statistical significance
- Using data that may not have been collected with your intended use in mind
- Putting all the pieces together to extract meaningful insights from your data and use them in a responsible way
-
Practical challenge
-
Epistemological challenge
-
Ethical challenge
-
Grand challenge
CorrectIncorrect -
Question 20 of 1443
20. Question
2. How does density affect a network?
Select all that applyCorrectIncorrect -
Question 21 of 1443
21. Question
2. Betweenness tells you which nodes can be
Select all that applyCorrectIncorrect -
Question 22 of 1443
22. Question
1. Which questions would seasonality analysis help answer?
Select all that applyCorrectIncorrect -
Question 23 of 1443
23. Question
CorrectIncorrect -
Question 24 of 1443
24. Question
1. Which two functions do you need to save your image output as a PDF?
Select all that applyCorrectIncorrect -
Question 25 of 1443
25. Question
2. Identify the three things necessary to make a graph in ggplot2.
CorrectIncorrect -
Question 26 of 1443
26. Question
2. Fill in the blank below.
-
2. The function searches for additional function types, such as geom_line and geom_point.
CorrectIncorrect -
-
Question 27 of 1443
27. Question
2. Which function do we use for each tab in our app?
CorrectIncorrect -
Question 28 of 1443
28. Question
2. Why do we cluster the basketball data with 3 clusters after we analyze it with 2 clusters?
CorrectIncorrect -
Question 29 of 1443
29. Question
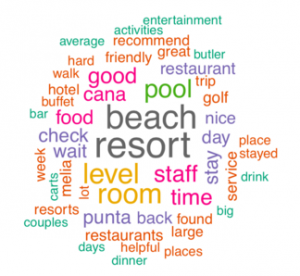
3. Based on this word cloud, generated from hotel reviews, order the words by frequency. Put the most frequently used words at the top.
-
Room
-
Golf
-
Staff
-
Beach
CorrectIncorrect -
-
Question 30 of 1443
30. Question
3. What is Big Data?
Select all that applyCorrectIncorrect -
Question 31 of 1443
31. Question
2. What happened when Target predicted pregnancy in their customers?
CorrectIncorrect -
Question 32 of 1443
32. Question
3. When building a forecasting model, it is better to have more variables in the model.
How often is this statement true?
CorrectIncorrect -
Question 33 of 1443
33. Question
2. Which function can you use in the igraph package to eliminate duplicate data?
CorrectIncorrect -
Question 34 of 1443
34. Question
2. Match the functions to the actions they perform in R.
Sort elements
- produces the variance of a data set
- creates a data frame
- view the output
- calculates the standard deviation
-
var()
-
data.frame()
-
View()
-
sd()
CorrectIncorrect -
Question 35 of 1443
35. Question
3. What is heteroscedasticity?
CorrectIncorrect -
Question 36 of 1443
36. Question
3. What is TRUE about adding more variables to your regression model?
Select all that applyCorrectIncorrect -
Question 37 of 1443
37. Question
2. Put the steps for calculating undirected eigenvectors in the correct order.
-
Each value in the eigenvector is divided by the top value to determine its relative eigenvector centrality.
-
Calculate degree centrality by summing the rows and assigning those new values to the nodes.
-
Sum the adjacent weights with the newly calculated values.
-
Repeat until the weights eventually converge.
-
When the values stabilize, they can be represented by a vector of values called an eigenvector.
CorrectIncorrect -
-
Question 38 of 1443
38. Question
2. What is an example of how the direction of trust does not always go both ways?
CorrectIncorrect -
Question 39 of 1443
39. Question
2. Why does it make sense to save a graph to PDF format?
Select all that applyCorrectIncorrect -
Question 40 of 1443
40. Question
3. Fill in the blank below.
-
3. It’s important to look at the raw data before you it so you can see what it looks like and find initial patterns and insights without doing too much analysis.
CorrectIncorrect -
-
Question 41 of 1443
41. Question
3. Why do we use packages for data manipulation instead of just using built-in R functions?
Select all that applyCorrectIncorrect -
Question 42 of 1443
42. Question
3. Why might bar graphs be misleading?
CorrectIncorrect -
Question 43 of 1443
43. Question
4. Which Shiny functions integrate Leaflet so it can be displayed as an application?
Select all that applyCorrectIncorrect -
Question 44 of 1443
44. Question
3. Why is clustering more powerful than visualizing?
Select all that applyCorrectIncorrect -
Question 45 of 1443
45. Question
4. Order these data formats from most to least structured.
-
Data with identifiable patterns in its presentation, but is without clear labels and organization
-
Data with labels and organization, but is not in a table
-
Data without a pre-defined format, such as sound or video data
-
Data presented in a table
CorrectIncorrect -
-
Question 46 of 1443
46. Question
4. Sort the network from the broadest community to the most niche community.
-
Rock and Pop concert goers
-
Casual listeners of music and podcasts
-
Music lovers
-
Alternative and Top 40 bloggers and columnists
CorrectIncorrect -
-
Question 47 of 1443
47. Question
5. Identify whether the activity would need a data science team member with a low level or high level of expertise.
Sort elements
- high level
- low level
- low level
- low level
- high level
- high level
- high level
- low level
-
Generate a new algorithm
-
Use tools (e.g., Tableau and Excel) to visualize data
-
Wrangle data
-
Manage data
-
Interpret results of analyses
-
Ask meaningful questions
-
Identify the weaknesses within a model
CorrectIncorrect -
Question 48 of 1443
48. Question
3. Which of the following are ethical questions you may face when using data?
Select all that applyCorrectIncorrect -
Question 49 of 1443
49. Question
4. Which of the below were top indicators for Target that a customer was pregnant?
Select all that applyCorrectIncorrect -
Question 50 of 1443
50. Question
Sort elements
- regression line
- Actual data points
- independent variable
- dependent variable
-
D
-
C
-
A
-
B
CorrectIncorrect -
Question 51 of 1443
51. Question
4. Fill in the blanks.
-
will set the horizontal limits of your map and will set the vertical limits of your map.
CorrectIncorrect -
-
Question 52 of 1443
52. Question
4. Put the 5 similar functions of an organization in the correct order.
-
Research and development
-
Sell
-
Ship
-
Buy
-
Make
CorrectIncorrect -
-
Question 53 of 1443
53. Question
4. Sort the variables as either continuous or discrete.
Sort elements
- Number of cars, number of buildings, temperature
- Days of the week, months of the year
- Colors, types of weather, names
-
Continuous variables
-
Discrete variables
-
Discrete variables without a defined sequence
CorrectIncorrect -
Question 54 of 1443
54. Question
5. Match the methods below to their respective purpose.
Sort elements
- Create a model where the relationship or trend changes over time
- Make scales of variables comparable so you can run a regression model
- Predict time-series results based on a historical average
- Identify periodicity of patterns in historical data
- Predict time-series results based on historical trend and regular fluctuations
- Predict time-series results based on a historical trend, changing level of activity across seasonal cycles and regular fluctuations
-
Polynomial regression
-
Variable transformation
-
Moving average
-
Autocorrelation
-
Seasonality (additive/multiplicative)
-
Holt-Winters: trend-corrected, seasonally adjusted, exponential smoothing
CorrectIncorrect -
Question 55 of 1443
55. Question
5. Fill in the blank below.
-
centrality measures a node’s (person’s) importance by giving consideration to importance of the nodes (people) connected to it.
CorrectIncorrect -
-
Question 56 of 1443
56. Question
4. Match the arguments to what they do.
Sort elements
- tells R whether to include a navigation bar
- set dimensions of the graph that are interpreted as pixels, this changes if you output pdf files instead of png files
- tells R whether to include the code at the bottom of the animation
-
navigator
-
ani.height and ani.width
-
verbose
CorrectIncorrect -
Question 57 of 1443
57. Question
4. What does Louvain Modularity assume?
CorrectIncorrect -
Question 58 of 1443
58. Question
5. The aes layer contains:
CorrectIncorrect -
Question 59 of 1443
59. Question
5. What aspects of a graph should you keep in mind while creating it?
Select all that applyCorrectIncorrect -
Question 60 of 1443
60. Question
What did you think of the material in this section?
CorrectIncorrect -
-
Question 61 of 1443
61. Question
5. What does missing data prevent?
CorrectIncorrect -
Question 62 of 1443
62. Question
5. What are some important things to remember when working with outliers in your data?
Select all that applyCorrectIncorrect -
Question 63 of 1443
63. Question
5. What is TRUE about followers in a directed network?
Select all that applyCorrectIncorrect -
Question 64 of 1443
64. Question
5. What is a takeaway we learned from analyzing Congressional donation data?
CorrectIncorrect -
Question 65 of 1443
65. Question
5. Which function eliminates duplicate rows?
CorrectIncorrect -
Question 66 of 1443
66. Question
Fill in the blanks below.
-
The method is part of unsupervised machine learning and discovers new patterns or groups of data, while the method is part of supervised machine learning and assigns data points to known groups or categories.
CorrectIncorrect -
-
Question 67 of 1443
67. Question
Sort elements
- SUM(Employees)
- MIN(Employees)
- LEN(Company)
- LEFT(Company,2)
- COUNT(*)
- SUBSTRING(Company,2,1)
-
Return the total number of Employees in the table
-
Return the smallest number of Employees in the table
-
Return the number of characters in the Company field
-
Return the first 2 characters of the Company field
-
Return the number of records in the table
-
Return the second character of the Company field
CorrectIncorrect -
Question 68 of 1443
68. Question
Match the models to the correlation they are displaying.
Sort elements
- Correlation = 1
- Correlation = 0
- Correlation = -1
CorrectIncorrect -
Question 69 of 1443
69. Question
How was Target able to identify their pregnant customers?
CorrectIncorrect -
Question 70 of 1443
70. Question
Which of the following SQL functions can be used on date fields?
Select all that applyCorrectIncorrect -
Question 71 of 1443
71. Question
Which operator pulls rows that contain specified terms you’re searching for to create a new dataset with only those rows?
CorrectIncorrect -
Question 72 of 1443
72. Question
Fill in the blank below.
-
The 'gg' in ggplot2 stands for .
CorrectIncorrect -
-
Question 73 of 1443
73. Question
Fill in the blank below.
-
To speed up our work and avoid running calculations on each data point manually, we can use the loop function, which performs a set of operations as many times as you tell it to. The advantage to this loop is that you can run different types of data through the same operations, and it does it automatically.
CorrectIncorrect -
-
Question 74 of 1443
74. Question
How do we know we still need to refine our model further?
CorrectIncorrect -
Question 75 of 1443
75. Question
CorrectIncorrect -
Question 76 of 1443
76. Question
CorrectIncorrect -
Question 77 of 1443
77. Question
Match the terms to the descriptions.
Sort elements
- Between sum of squares
- Within sum of squares
- Total sum of squares
-
Sum of all the squared distances between data points in different clusters
-
Sum of all the squared distances between points within the same cluster
-
Total sum of squares
CorrectIncorrect -
Question 78 of 1443
78. Question
Match each data quality with its description.
Sort elements
- The data was recorded correctly
- All relevant data was recorded
- Entities are recorded once
- The data is kept up to date
- The data agrees with itself
-
Accuracy
-
Completeness
-
Uniqueness
-
Timeliness
-
Consistency
CorrectIncorrect -
Question 79 of 1443
79. Question
In which scenario below would we want to minimize the false negatives of our model?
Please select all that applyCorrectIncorrect -
Question 80 of 1443
80. Question
What are some of the fields that text mining methods employ?
Please select all that applyCorrectIncorrect -
Question 81 of 1443
81. Question
How does clustering help when there are more than 3 attributes in the data?
CorrectIncorrect -
Question 82 of 1443
82. Question
Please fill in the blanks below:
-
is the most popular hierarchical clustering method, it’s a bottom-up approach, while does the opposite and is a top-down approach.
CorrectIncorrect -
-
Question 83 of 1443
83. Question
5. Which of these is an example of exploratory data analysis?
CorrectIncorrect -
Question 84 of 1443
84. Question
Which piece of code will retrieve only the third column of a matrix called 'm'?
CorrectIncorrect -
Question 85 of 1443
85. Question
What types of data are difficult to cluster?
Select all that applyCorrectIncorrect -
Question 86 of 1443
86. Question
Which questions can datafication help us answer
Select all that applyCorrectIncorrect -
Question 87 of 1443
87. Question
Which function converts wide data to long data?
CorrectIncorrect -
Question 88 of 1443
88. Question
Which of these is an example of exploratory data analysis?
CorrectIncorrect -
Question 89 of 1443
89. Question
How can we address the limitations of our analysis to see the data differently?
Select all that applyCorrectIncorrect -
Question 90 of 1443
90. Question
What is heteroscedasticity?
CorrectIncorrect -
Question 91 of 1443
91. Question
Which function would I use to change transform the text below to all capital letters?
coUpE --> COUPE
CorrectIncorrect -
Question 92 of 1443
92. Question
What is R Squared?
CorrectIncorrect -
Question 93 of 1443
93. Question
What is the objective of solving an optimization problem?
CorrectIncorrect -
Question 94 of 1443
94. Question
What type of data analysis gives you an overview of your data quickly by visualizing it?
CorrectIncorrect -
Question 95 of 1443
95. Question
Which R function makes sure that we can reproduce the exact same results when we use the createFolds() function?
CorrectIncorrect -
Question 96 of 1443
96. Question
CorrectIncorrect -
Question 97 of 1443
97. Question
What is a moving average?
CorrectIncorrect -
Question 98 of 1443
98. Question
Why do we use the silhouette coefficient to determine the number of clusters for sk-means?
CorrectIncorrect -
Question 99 of 1443
99. Question
Why is it important to convert all words to lower case before removing 'stop words'?
CorrectIncorrect -
Question 100 of 1443
100. Question
1. Fill in the blank below.
-
is the process of extracting information from large quantities of data to find insights, patterns and other latent information.
CorrectIncorrect -
-
Question 101 of 1443
101. Question
1. Fill in the blank below.
-
The goal of an rule is to extract correlation relationships in the large datasets of items. Ideally, these relationships will be causative.
CorrectIncorrect -
-
Question 102 of 1443
102. Question
1. Fill in the blank below.
-
If you ignore factors, then the most recent trend is used in conjunction with the last data point to make a static projection.
CorrectIncorrect -
-
Question 103 of 1443
103. Question
1. Why does R put an 'X' in front of numerical column names?
Select all that applyCorrectIncorrect -
Question 104 of 1443
104. Question
1. Fill in the blank below.
-
The function allows us to wrap multiple Shiny apps into one and click between them.
CorrectIncorrect -
-
Question 105 of 1443
105. Question
1. Why did NAs appear when we initially read in the data?
CorrectIncorrect -
Question 106 of 1443
106. Question
Based on this comparison cloud, order the customer comments according to those that are most consistently complimentary (at the top) and those most negative and pervasive(at the bottom).
-
"Great staff!"
-
"I had a hard time making a reservation."
-
"The variety of activities available were a big plus."
-
"Did this place get more expensive?!!!!!!"
CorrectIncorrect -
-
Question 107 of 1443
107. Question
1. What can we conclude about the statistic that there are 88 guns for every 100 Americans?
CorrectIncorrect -
Question 108 of 1443
108. Question
1. Which of the following sources would need to be datafied or converted into numbers, so that you can run analyses and gain greater insight?
Select all that applyCorrectIncorrect -
Question 109 of 1443
109. Question
1. Which function should I use if I want to make sure my results are reproducible?
CorrectIncorrect -
Question 110 of 1443
110. Question
1. Fill in the blanks below.
-
Sometimes, in order to analyze relationships between variables we need to the data in order to isolate certain effects, make the scales similar, etc. The package is very helpful at transforming a lot of data quickly.
CorrectIncorrect -
-
Question 111 of 1443
111. Question
1. What does the ".SD" notation stand for?
CorrectIncorrect -
Question 112 of 1443
112. Question
1. Fill in the blank below.
-
The Index will calculate the similarity between politicians # and their donors by comparing the people that they are connected to.
CorrectIncorrect -
-
Question 113 of 1443
113. Question
2. Drag the term to the box next to the correct description.
Sort elements
- Vector
- Matrix
- List
- Data frame
-
Collection of elements of the same type
-
Multiple rows and columns of the same data type
-
Collection of elements of different types
-
Multiple rows and columns of different data types
CorrectIncorrect -
Question 114 of 1443
114. Question
3. Which function generates a vector of numbers with a specified range that can count by another number?
CorrectIncorrect -
Question 115 of 1443
115. Question
2. Which package can we use to scrape websites for information?
CorrectIncorrect -
Question 116 of 1443
116. Question
3. What are some conclusions we see when we graph points per game by minutes per game with three clusters?
Select all that applyCorrectIncorrect -
Question 117 of 1443
117. Question
3. When summarizing a long document via text analysis, the most "important" words will be determined by:
CorrectIncorrect -
Question 118 of 1443
118. Question
2. Which aspect of Big Data is highlighted in these examples?
-Location data from mobile phones can infer how many people were in Macy’s on Black Friday, estimating sales before Macy's aggregates the numbers.
-Amazon's product catalogue receives more than 50 million updates a week, and deliveries and inventories are tracked in real time.CorrectIncorrect -
Question 119 of 1443
119. Question
3. Naïve Bayes is probabilistic classification method commonly used for text classification. Most spam filters are based on a variant of Naïve Bayes.
Order the steps that a spam filter takes when deciding whether or not a new email should be placed in the spam folder. Place the first step at the top.
-
Based on the results of the search, the probability of the email being spam is determined
-
The spam filter searches for keywords or word combinations that are frequently found in spam
-
The probability is evaluated against its threshold and decides whether to sort the email as spam or not
-
The text of the new is email is analyzed
CorrectIncorrect -
-
Question 120 of 1443
120. Question
2. Order the steps needed to build a multivariate regression model.
-
Decide what you want to predict
-
Check your test statistics to see measures of accuracy, correlation, and error
-
Run a regression analysis
-
Identify variables and data you think will influence the prediction
-
Refine your model
CorrectIncorrect -
-
Question 121 of 1443
121. Question
3. Use the edge.attr.comb argument to
CorrectIncorrect -
Question 122 of 1443
122. Question
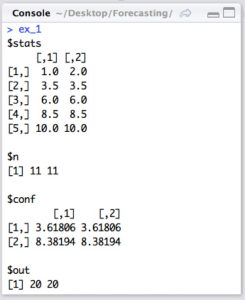
Sort elements
- includes the values of the boxplot levels. The five rows include the bottom whisker, the 25th percentile, the 50th percentile, the 75th percentile and the top whisker
- includes the number of values in each variable
- includes something called notches or the median plus and minus roughly one point five times the inter-quartile range
- includes the values of the outliers, which you can also see in the boxplot
-
$stats
-
$n
-
$conf
-
$out
CorrectIncorrect -
Question 123 of 1443
123. Question
2. What does the Akaike Information Criterion (AIC) do?
Select all that applyCorrectIncorrect -
Question 124 of 1443
124. Question
3. Put the steps of the data science control cycle in the correct order.
-
Validate: Do the model and assumptions work as expected?
-
Ask: What is the problem(s) we need to solve?
-
Research: What data do we need and how do we get it?
-
Interpret: How can we use the conclusions in the real world?
-
Model: Which method(s) is appropriate to use?
-
Test: How does the model generalize to real world data?
CorrectIncorrect -
-
Question 125 of 1443
125. Question
3. What is TRUE about an identity matrix?
Select all that applyCorrectIncorrect -
Question 126 of 1443
126. Question
2. Fill in the blank below.
-
The Index is a way of measuring the extent of similarity between two people or objects.
CorrectIncorrect -
-
Question 127 of 1443
127. Question
3. Please fill in the blanks below:
-
identifies people who have similar connections, not necessarily people who are connected. identifies communities that are indeed connected.
CorrectIncorrect -
-
Question 128 of 1443
128. Question
3. Match the function to its purpose.
Sort elements
- searches for text in data
- gives you the length of any vector
- tabulates the number of entries for categorical data
- sorts data by a particular column
-
grep()
-
length()
-
table()
-
order()
CorrectIncorrect -
Question 129 of 1443
129. Question
4. Fill in the blank below.
-
In graphics, transparency is called , where 0 is entirely transparent, and the default of 1 is entirely opaque.
CorrectIncorrect -
-
Question 130 of 1443
130. Question
4. Visualization is an iterative process. Put the steps in order starting with "Analyze"
-
Repeat
-
Manipulate
-
Analyze
-
Graph
CorrectIncorrect -
-
Question 131 of 1443
131. Question
4. What is the output of this R code?
"matrix"[,c(1:4)]
CorrectIncorrect -
Question 132 of 1443
132. Question
4. In order for us to determine how much variation our clusters account for, we need to:
Select all that applyCorrectIncorrect -
Question 133 of 1443
133. Question
3. Which of the following are epistemological challenges?
CorrectIncorrect -
Question 134 of 1443
134. Question
5. Networks can contain a wealth of information. Which of the following questions are best be answered by measuring an aspect of the network (assuming the necessary data are available).
CorrectIncorrect -
Question 135 of 1443
135. Question
4. Data analysis can provide:
Select all that applyCorrectIncorrect -
Question 136 of 1443
136. Question
5. Fill in the missing words.
-
Knowing the task at hand with help you choose the best tool for the job. When processing videos and images, manipulating files quickly, analyzing data, or creating dynamic or interactive visualizations, is a better tool to use than , which is better for when you have received minimal training or are viewing data.
CorrectIncorrect -
-
Question 137 of 1443
137. Question
4. Which assumption does Naïve Bayes make about its attributes?
CorrectIncorrect -
Question 138 of 1443
138. Question
5. If most of the data points cluster around a regression line, it may be the case that:
CorrectIncorrect -
Question 139 of 1443
139. Question
3. Which function would you use to pull the longitude and latitude figures from Google?
CorrectIncorrect -
Question 140 of 1443
140. Question
5. Match the questions with the correct step in the Data Science Control Cycle.
Sort elements
- What is the problem we need to solve?
- What data do you need for your analysis and how can you get it?
- Which method(s) is appropriate to use?
- Do the model and assumptions work as expected?
- How does the model generalize to real world data?
- How can we use the conclusions in the real world?
-
Ask
-
Research
-
Model
-
Validate
-
Test
-
Interpret
CorrectIncorrect -
Question 141 of 1443
141. Question
5. How do we know we still need to refine our model further?
CorrectIncorrect -
Question 142 of 1443
142. Question
4. Put the steps of time series data methodology in correct order.
-
Check for seasonality
-
Determine if the pattern is additive or multiplicative
-
Create a confidence interval for your forecast
-
Forecast using trend-corrected seasonally-adjusted exponential smoothing
-
Identify the periodicity of the seasonal pattern
CorrectIncorrect -
-
Question 143 of 1443
143. Question
4. What is TRUE about top observers or collectors of information in a network?
Select all that applyCorrectIncorrect -
Question 144 of 1443
144. Question
4. Put the steps of the Data Science Control Cycle in order.
-
Ask - What is the problem(s) we need to solve?
-
Research - What data do we need and how do we get it?
-
Validate - Do the model and assumptions work as expected?
-
Model - Which method(s) is appropriate to use?
-
Test - How does the model generalize to real world data?
CorrectIncorrect -
-
Question 145 of 1443
145. Question
4. Which method allows us to build a recommendation engine?
CorrectIncorrect -
Question 146 of 1443
146. Question
3. Why is it important to understand different data types?
Select all that applyCorrectIncorrect -
Question 147 of 1443
147. Question
5. Why do we build visualizations?
Select all that applyCorrectIncorrect -
Question 148 of 1443
148. Question
5. When Hewlett Packard started tracking a range of employee factors, what were the results?
CorrectIncorrect -
Question 149 of 1443
149. Question
5. You are creating a feedback survey to send your customers. You already know their zip code, education level, and age. Which additional survey item captures a different type of information and may add explanatory power to your model?
CorrectIncorrect -
Question 150 of 1443
150. Question
5. What is R Squared?
CorrectIncorrect -
Question 151 of 1443
151. Question
5. What is important to keep in mind when calculating eigenvector centrality in R?
Select all that applyCorrectIncorrect -
Question 152 of 1443
152. Question
5. What is a limitation of calculating edge betweenness in large networks?
CorrectIncorrect -
Question 153 of 1443
153. Question
5. Why do we build visualizations?
CorrectIncorrect -
Question 154 of 1443
154. Question
Fill in the blank below.
-
The main goal of clustering is to intra-cluster distance (the distance between points in a cluster) and inter-cluster distance (the distance between clusters). This ensures that the clusters are as defined and separated as possible.
CorrectIncorrect -
-
Question 155 of 1443
155. Question
Table: Company_Employees
Which SQL code will result in a frequency distribution of the Company field?
CorrectIncorrect -
Question 156 of 1443
156. Question
How do you measure the explanatory power of your predictive model?
CorrectIncorrect -
Question 157 of 1443
157. Question
Put the four steps of building a classification tree in order.
-
Stop growing the tree when there is no more information gain
-
Conditional on the previous answer, select the next question
-
Ask the question with the most amount of information
-
Create a new question branch after the previous one
CorrectIncorrect -
-
Question 158 of 1443
158. Question
Put the following SQL clauses in the correct standard query template order:
-
SELECT
-
GROUP BY
-
HAVING
-
ORDER BY
-
INTO
-
FROM
-
WHERE
CorrectIncorrect -
-
Question 159 of 1443
159. Question
Put the six Data Science control cycle steps in order, starting with “Ask”
-
Validate
-
Test
-
Model
-
Interpret
-
Research
-
Ask
CorrectIncorrect -
-
Question 160 of 1443
160. Question
Identify the three things necessary to make a graph in ggplot2.
Select all that applyCorrectIncorrect -
Question 161 of 1443
161. Question
Match the functions to the actions they perform in R.
Sort elements
- produces the variance of a data set
- creates a data frame
- view the output
- calculates the standard deviation
-
var()
-
data.frame()
-
View()
-
sd()
CorrectIncorrect -
Question 162 of 1443
162. Question
What are some things you should always check for in your model?
Select all that applyCorrectIncorrect -
Question 163 of 1443
163. Question
Match the function names to their descriptions.
Sort elements
- LEN()
- SEARCH()
- REPLACE()
-
Returns the length of a cell, or number of characters of text in a cell
-
Returns the number of the character at which a specific character or text string starts
-
Replaces part of a text string with another text string
CorrectIncorrect -
Question 164 of 1443
164. Question
Match the function names to their descriptions.
Sort elements
- LEN()
- SEARCH()
- REPLACE()
-
Returns the length of a cell, or number of characters of text in a cell
-
Returns the number of the character at which a specific character or text string starts
-
Replaces part of a text string with another text string
CorrectIncorrect -
Question 165 of 1443
165. Question
In order for us to determine how much variation our clusters account for, we need to:
CorrectIncorrect -
Question 166 of 1443
166. Question
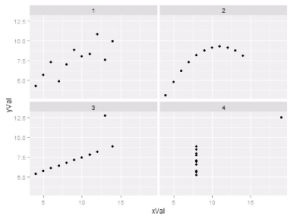
The datasets graphed all have similar summary statistics (including means and variances). What valuable lesson(s) can be learned from comparing the graphs?
CorrectIncorrect -
Question 167 of 1443
167. Question
What are some of the strengths of Naive Bayes classifier?
Please select all that applyCorrectIncorrect -
Question 168 of 1443
168. Question
Match the definition to the term by dragging and dropping it into the chart.
Sort elements
- Web scraping
- Corpus
- Text mining
-
Retrieving data from an online source, usually a web page
-
Collection of documents
-
A process that focuses on obtaining insights from text data
CorrectIncorrect -
Question 169 of 1443
169. Question
CorrectIncorrect -
Question 170 of 1443
170. Question
Hierarchical clustering assumes that points with the shortest distance between them are:
CorrectIncorrect -
Question 171 of 1443
171. Question
Was this hard?
CorrectIncorrect -
Question 172 of 1443
172. Question
Why do we use ‘==‘ instead of ‘=‘ to pull the day shift data?
CorrectIncorrect -
Question 173 of 1443
173. Question
What does it mean when there is a high positive correlation between two attributes?
CorrectIncorrect -
Question 174 of 1443
174. Question
What is a good way to test for multicollinearity?
CorrectIncorrect -
Question 175 of 1443
175. Question
Why does R put an 'X' in front of numerical column names?
Select all that applyCorrectIncorrect -
Question 176 of 1443
176. Question
What happened when Telenor started contacting its customers?
CorrectIncorrect -
Question 177 of 1443
177. Question
Why do we look at correlations between players' salaries and player statistics?
CorrectIncorrect -
Question 178 of 1443
178. Question
Which statement is not true if you receive a positive result from a cancer test that is 95% accurate with a base rate of 1 out of 5,000 people a month?
CorrectIncorrect -
Question 179 of 1443
179. Question
Please fill in the blank below.
-
These two functions allow you to look up a value in a table, and return the desired value from another column in that table. The is for vertical tables, and the is for horizontal tables.
CorrectIncorrect -
-
Question 180 of 1443
180. Question
What does it mean if you have a small p-value?
CorrectIncorrect -
Question 181 of 1443
181. Question
What happened when Telenor started contacting its customers?
CorrectIncorrect -
Question 182 of 1443
182. Question
CorrectIncorrect -
Question 183 of 1443
183. Question
Which function creates data for the ROC curve?
CorrectIncorrect -
Question 184 of 1443
184. Question
Which package do we use to implement boosting in R?
CorrectIncorrect -
Question 185 of 1443
185. Question
Which function applies linear filtering to time series?
CorrectIncorrect -
Question 186 of 1443
186. Question
Why wouldn't a silhouette value be computed with one cluster?
CorrectIncorrect -
Question 187 of 1443
187. Question
What is a Term Document Matrix?
CorrectIncorrect -
Question 188 of 1443
188. Question
1. Fill in the blank below.
-
Clustering assumes that is a measure for similarity. In other words, data points that are “closer” together are probably more similar than data points that are farther apart.
CorrectIncorrect -
-
Question 189 of 1443
189. Question
1. Fill in the blank.
-
There are many methods for analyzing data. When forecasting or predicting future events, the two most common methods are classification and .
CorrectIncorrect -
-
Question 190 of 1443
190. Question
1. Match the functions to the actions that they perform in R.
Sort elements
- sets up the network data
- checks the structure of the output
- pulls attributes of graph vertices
- pulls attributes of graph edges
-
graph.data.frame()
-
str()
-
V()
-
E()
CorrectIncorrect -
Question 191 of 1443
191. Question
1. Which function converts wide data to long data?
CorrectIncorrect -
Question 192 of 1443
192. Question
1. Fill in the blank below
-
Many organizations make their data publicly available through APIs, which stands for .
CorrectIncorrect -
-
Question 193 of 1443
193. Question
1. List the six steps of the Clustering control cycle, starting with "Load Data".
-
Cluster
-
Interpret results
-
Visualize data
-
Predict clusters
-
Check variance
-
Load data
CorrectIncorrect -
-
Question 194 of 1443
194. Question
2. Fill in the blank.
-
After text mining, it is often helpful to your data. Word clouds and histograms can help you communicate your findings to others.
CorrectIncorrect -
-
Question 195 of 1443
195. Question
2. Identify five basic tools you will need to do a data science project
Select all that applyCorrectIncorrect -
Question 196 of 1443
196. Question
1. Which of these methods extracts latent topics from text?
CorrectIncorrect -
Question 197 of 1443
197. Question
2. Match the arguments you might use when plotting a base map.
Sort elements
- determines the color of each region of the map
- determines whether or not to apply the fill colors
- sets the background color
- thickness of separating lines
- horizontal limits
- vertical limits
-
col
-
fill
-
bg
-
lwd
-
xlim
-
ylim
CorrectIncorrect -
Question 198 of 1443
198. Question
1. Fill in the blank below.
-
is a pattern that occurs at a regular interval over time.
CorrectIncorrect -
-
Question 199 of 1443
199. Question
1. Which function can you use to calculate betweenness centrality?
CorrectIncorrect -
Question 200 of 1443
200. Question
1. Which package has the gather function?
CorrectIncorrect -
Question 201 of 1443
201. Question
1. Drag the description into the box next to the appropriate term.
Sort elements
- whole number
- number with decimals
- data type written out in words
- either TRUE or FALSE
- variable that can be assigned value
-
Integer
-
Double
-
String/characters
-
Boolean/logicals
-
Factor
CorrectIncorrect -
Question 202 of 1443
202. Question
2. Why has creating 3D visualizations become easier in R?
CorrectIncorrect -
Question 203 of 1443
203. Question
2. What are the three main columns we need to specify in the network data frame to describe relationships in the network?
CorrectIncorrect -
Question 204 of 1443
204. Question
2. Why do we need to transpose our data set?
CorrectIncorrect -
Question 205 of 1443
205. Question
3. Sets of variables are provided. Identify whether the set is most likely an example of correlation or causation.
Sort elements
- Causation
- Correlation
- Correlation
- Correlation
- Causation
- Causation
-
Number of school hours missed and student achievement
-
Number of fire trucks dispatched and amount of property damage
-
Amount of money spent each week on vegetables and changes in weight
-
Number of purchases of rain boots and percent of delayed flights
CorrectIncorrect -
Question 206 of 1443
206. Question
3. How was Capital One able to provide customized credit products?
CorrectIncorrect -
Question 207 of 1443
207. Question
2. You are testing a new classification algorithm. Which of the following results may suggest that your algorithm is performing accurately?
CorrectIncorrect -
Question 208 of 1443
208. Question
2. What does R squared measure?
CorrectIncorrect -
Question 209 of 1443
209. Question
2. Fill in the blank below.
-
When column titles have dashes or titles using hyphens or spaces, you need to enclose the title with the accent.
CorrectIncorrect -
-
Question 210 of 1443
210. Question
2. What are some ways you can identify outliers in your data?
Select all that applyCorrectIncorrect -
Question 211 of 1443
211. Question
3. What are some key things you should always check for in your model?
Select all that applyCorrectIncorrect -
Question 212 of 1443
212. Question
2. What data CAN'T we get from Twitter?
CorrectIncorrect -
Question 213 of 1443
213. Question
2. Match the symbols to what they represent when calculating an eigenvector.
Sort elements
- a matrix, such as an adjacency matrix
- identity matrix of A
- an eigenvalue of matrix A
- eigenvector of matrix A
-
A
-
I
-
λ
-
ν
CorrectIncorrect -
Question 214 of 1443
214. Question
2. What are some things we can figure out using The Sunlight Foundation API?
Select all that applyCorrectIncorrect -
Question 215 of 1443
215. Question
3. Put the steps of the cluster_edge_betweenness() function in order.
-
Remove the edge or edges with the highest edge betweenness score.
-
Again remove the edge or edges with the highest edge betweenness score.
-
Recalculate the edge betweenness score for each edge.
-
Calculate the edge betweenness of all the edges in the graph.
-
Stop when either the modularity reaches 0.75 or when there are no more superlative edges left, whichever comes first.
CorrectIncorrect -
-
Question 216 of 1443
216. Question
2. Fill in the blank below.
-
R is a powerful tool for because the graphics tie in with the functions used to analyze data
CorrectIncorrect -
-
Question 217 of 1443
217. Question
5. Match the function names to their descriptions.
Sort elements
- labs()
- coord_flip()
- facet_wrap()
- geom_area()
-
Sets labels for axes and title
-
Flips the axes of a graph
-
Splits up data by category to give smaller individual graphs
-
Creates an area plot
CorrectIncorrect -
Question 218 of 1443
218. Question
4. What are some common languages to create websites?
Select all that applyCorrectIncorrect -
Question 219 of 1443
219. Question
5. What R code would give me the information in the 3rd-6th rows of the crime data set?
CorrectIncorrect -
Question 220 of 1443
220. Question
4. How do you fix the following error?
Error in plot.new() : figure margins too large
CorrectIncorrect -
Question 221 of 1443
221. Question
4. Which of the following are ethical questions you may face when using data?
CorrectIncorrect -
Question 222 of 1443
222. Question
4. Your target demographic is educated, single women who are 25-40 years old. If you use text mining to analyze their comments on your website, what might you find?
CorrectIncorrect -
Question 223 of 1443
223. Question
5. In his experiment, Philip Tetlock found that:
Select all that applyCorrectIncorrect -
Question 224 of 1443
224. Question
4. Which programming languages can not be used for data analysis?
CorrectIncorrect -
Question 225 of 1443
225. Question
4. Increasing the number of variables in a predictive model may not be beneficial because...
CorrectIncorrect -
Question 226 of 1443
226. Question
4. If two factors are strongly correlated, such as "temperature" and "what the temperature feels like" in our Bikeshare example, then we are...
Select all that applyCorrectIncorrect -
Question 227 of 1443
227. Question
4. Networks can be measured and visualized by
Select all that applyCorrectIncorrect -
Question 228 of 1443
228. Question
3. Which of these use cases are examples of how regression is applied? Select all that apply.
Select all that applyCorrectIncorrect -
Question 229 of 1443
229. Question
4. Which package do we use to run the vif() function?
CorrectIncorrect -
Question 230 of 1443
230. Question
4. What is important to know about span?
Select all that applyCorrectIncorrect -
Question 231 of 1443
231. Question
4. What is a scalar?
CorrectIncorrect -
Question 232 of 1443
232. Question
4. What is TRUE about the Jaccard Index?
CorrectIncorrect -
Question 233 of 1443
233. Question
4. What is the given modularity score to stop iterations at?
CorrectIncorrect -
Question 234 of 1443
234. Question
4. What is the output of this R code?
"matrix"[,c(1:4)]
CorrectIncorrect -
Question 235 of 1443
235. Question
5. Why is it easier to create interactive experiences in R today?
CorrectIncorrect -
Question 236 of 1443
236. Question
5. Which aspect of Big Data is highlighted in these examples?
-Location data from mobile phones can infer how many people were in Macy’s on Black Friday, estimating sales before Macy's aggregates the numbers.
-Amazon's product catalogue receives more than 50 million updates a week, and deliveries and inventories are tracked in real time.CorrectIncorrect -
Question 237 of 1443
237. Question
5. Why is S more intuitive than R squared?
CorrectIncorrect -
Question 238 of 1443
238. Question
5. What is TRUE about outliers?
Select all that applyCorrectIncorrect -
Question 239 of 1443
239. Question
5. What do networks represent?
Select all that applyCorrectIncorrect -
Question 240 of 1443
240. Question
5. What happened when we ran label propagation 100 times on the congressional data?
CorrectIncorrect -
Question 241 of 1443
241. Question
5. Which package should you install to plot an interactive network visualization?
CorrectIncorrect -
Question 242 of 1443
242. Question
Fill in the blank below.
CorrectIncorrect -
Question 243 of 1443
243. Question
Match the table type to the statement that would create it:
Sort elements
- INTO ##TableName
- INTO #TableName
- INTO TableName
-
Global Temporary Table
-
Local Temporary Table
-
Permanent table
CorrectIncorrect -
Question 244 of 1443
244. Question
Match the terms to their definitions.
Sort elements
- Measure of how dispersed the data is
- Standardized measure of how dispersed the data is
- Check if there is bias in the data or the model
- Measure of linear relationship between variables (positive/negative)
- Measure of strength of linear relationship between variables (positive/negative)
- How a change in variable x will affect variable y
- % of variation in y that can be explained by the variation in x
- The probability that the pattern exists through random chance, in the absence of a relationship between variables
-
Variance
-
Standard deviation
-
Distribution and "normality"
-
Covariance
-
Correlation
-
Slope
-
R squared
-
p-values
CorrectIncorrect -
Question 245 of 1443
245. Question
Match the attributes to the decision tree calculation.
Sort elements
- Entropy
- Gini impurity
-
Categorical attributes
Finds the largest class in the data
Uses algorithms
-
Continuous variables
Finds groups of classes that make up over 50% of their data
Minimizes classification
CorrectIncorrect -
Question 246 of 1443
246. Question
What are the three types of relationships between tables?
Select all that applyCorrectIncorrect -
Question 247 of 1443
247. Question
Good coding habits include:
Select all that applyCorrectIncorrect -
Question 248 of 1443
248. Question
Fill in the blank below.
CorrectIncorrect -
Question 249 of 1443
249. Question
Fill in the blank below.
-
can have a very negative impact on linear regressions if they are not identified and handled properly because they can skew the algorithm. It's important to identify them early and determine why they do not conform to the majority of the data points in case you need to adjust your model. You can identify them with Cook's distance or boxplots.
CorrectIncorrect -
-
Question 250 of 1443
250. Question
Match the key terms below to their descriptions.
Sort elements
- Check if there is bias in the data or the model
- The probability that the pattern exists through random chance
- Test for multicollinearity and independent variable interaction
- Check the residuals for heteroscedasticity (pattern contingent on fitted values)
- Check for information loss when selecting the right model for your data
-
Q-Q plot/ distribution of errors
-
p-values
-
VIF
-
Breusch-Pagan test
-
AIC
CorrectIncorrect -
Question 251 of 1443
251. Question
What are some ways you can adjust text in the 'Alignment' tab?
CorrectIncorrect -
Question 252 of 1443
252. Question
What are some ways you can adjust text in the 'Alignment' tab?
CorrectIncorrect -
Question 253 of 1443
253. Question
What are some conclusions from the visualization of Congress?
Select all that applyCorrectIncorrect -
Question 254 of 1443
254. Question
What are some important features of visual interactivity?
Select all that applyCorrectIncorrect -
Question 255 of 1443
255. Question
Please fill in the blank below.
-
Logistic regression can also be described as regression, which means that there are only two categories for classification.
CorrectIncorrect -
-
Question 256 of 1443
256. Question
Please match the text mining function to the descriptions.
Sort elements
- Vcorpus
- Corpus
- SimpleCorpus
- PCorpus
- DCorpus
-
Creates a volatile corpus object that is fully kept in memory
-
Creates a corpus with metadata from an object
-
Creates a simple corpus
-
Stores documents outside of R in a database
-
Creates a distributed corpus, a corpus that resides in a certain distributed file system
CorrectIncorrect -
Question 257 of 1443
257. Question
Please fill in the blank below.
-
distance measures the distance between points by taking the cosine of the angle between them, which measures the similarity between those points both based on the attributes they have and the difference between the attributes they don't have.
CorrectIncorrect -
-
Question 258 of 1443
258. Question
Please fill in the blanks below:
-
If two nodes are in the same community, then their delta is equal to , otherwise it’s equal to .
CorrectIncorrect -
-
Question 259 of 1443
259. Question
3. What does it mean to “practice” coding?
CorrectIncorrect -
Question 260 of 1443
260. Question
Why does it make sense to separate the code in multiple steps?
Select all that applyCorrectIncorrect -
Question 261 of 1443
261. Question
Why do we look at correlations between players' salaries and player statistics?
CorrectIncorrect -
Question 262 of 1443
262. Question
Which package do we use to run the vif() function?
CorrectIncorrect -
Question 263 of 1443
263. Question
Why do we use packages for data manipulation instead of just using built-in R functions?
Select all that applyCorrectIncorrect -
Question 264 of 1443
264. Question
Which of these are examples of clustering?
Select all that applyCorrectIncorrect -
Question 265 of 1443
265. Question
Which functions below allow you to compare your data set to a normal distribution and plot a bifurcating line on the graph?
Select all that applyCorrectIncorrect -
Question 266 of 1443
266. Question
What function do you need to use to perform the k Nearest Neighbors algorithm?
CorrectIncorrect -
Question 267 of 1443
267. Question
Which function looks up a particular value in a table and produces the row in which the value is located?
CorrectIncorrect -
Question 268 of 1443
268. Question
What do you need to run an F-test?
Select all that applyCorrectIncorrect -
Question 269 of 1443
269. Question
Which of these are examples of clustering?
Select all that applyCorrectIncorrect -
Question 270 of 1443
270. Question
Which language is HighCharts originally written in?
CorrectIncorrect -
Question 271 of 1443
271. Question
What is the implication if you have an AUC of 1?
Please select all that applyCorrectIncorrect -
Question 272 of 1443
272. Question
What package can you use at transforming data quickly?
CorrectIncorrect -
Question 273 of 1443
273. Question
What is one of the differences between additive and multiplicative seasonality?
CorrectIncorrect -
Question 274 of 1443
274. Question
Why do we look at 4 and 9 clusters when they only have an explained variance of 13.4%?
CorrectIncorrect -
Question 275 of 1443
275. Question
What is the output of Luhn's method?
CorrectIncorrect -
Question 276 of 1443
276. Question
1. Clustering is a form of what type of comparison?
CorrectIncorrect -
Question 277 of 1443
277. Question
1. Fill in the blank.
-
regression is just like univariate or linear regression, but instead of using just two variables to build a model, it can factor in more variables when building the forecasting model.
CorrectIncorrect -
-
Question 278 of 1443
278. Question
1. Approximately how many needlesticks are there annually in the United States?
CorrectIncorrect -
Question 279 of 1443
279. Question
1. Which function creates a heatmap?
CorrectIncorrect -
Question 280 of 1443
280. Question
1. Fill in the blank below
-
Networks are composed of two main concepts - , which represent the entities we're interested in, and , which are the relationships between these entities.
CorrectIncorrect -
-
Question 281 of 1443
281. Question
1. Why do we use the silhouette coefficient to determine the number of clusters for sk-means?
CorrectIncorrect -
Question 282 of 1443
282. Question
2. Forecasts of consumer demand can inform decision making by...
CorrectIncorrect -
Question 283 of 1443
283. Question
1. When should you identify how much and what type of data you have?
CorrectIncorrect -
Question 284 of 1443
284. Question
2. Forecasts of consumer demand can inform decision making by...
Select all that applyCorrectIncorrect -
Question 285 of 1443
285. Question
1. What data did we remove because it was creating "noise" in our visualization?
Select all that applyCorrectIncorrect -
Question 286 of 1443
286. Question
2. Match the common seasonal patterns to the correct unit of time.
Sort elements
- Commercials on TV captured every minute
- Electricity use captured every hour
- Hours worked captured every day
- Checks cashed captured every month
- Demand and sales of everything from ice cream to electricity fluctuate in annual patterns
-
Hourly
-
Daily
-
Weekly
-
Monthly
-
Yearly
CorrectIncorrect -
Question 287 of 1443
287. Question
1. Fill in the blank below.
-
You can quantify a network via an matrix where the rows and columns represent the nodes and the values in the matrix represent the strength of the connections.
CorrectIncorrect -
-
Question 288 of 1443
288. Question
1. What is TRUE if more people know each other in a community?
Select all that applyCorrectIncorrect -
Question 289 of 1443
289. Question
2. Which type of data contain sets of categories?
CorrectIncorrect -
Question 290 of 1443
290. Question
3. How do we add color by category within the 'threejs' package?
CorrectIncorrect -
Question 291 of 1443
291. Question
3. What are some insights we discovered when we visualized the Saturday Night Live data?
Select all that applyCorrectIncorrect -
Question 292 of 1443
292. Question
2. What is one limitation of the k-means analysis we performed in the previous video?
CorrectIncorrect -
Question 293 of 1443
293. Question
3. When building a forecasting model, it is better to have more variables in the model.
How often is this statement true?
CorrectIncorrect -
Question 294 of 1443
294. Question
2. Which of these social media sites share data with 3rd parties?
Select all that applyCorrectIncorrect -
Question 295 of 1443
295. Question
3. If your classification model has a perfect, 100% accuracy, which of the following questions should you ask?
Select all that applyCorrectIncorrect -
Question 296 of 1443
296. Question
2. When would bike demand be the greatest in Washington DC?
CorrectIncorrect -
Question 297 of 1443
297. Question
3. Match the terms to the their definitions.
Sort elements
- Average the shortest path lengths from the node to every other node in the network. Measures who has the broadest reach, which can be useful when determining shipping routes or developing a viral marketing campaign.
- Displays the first given number of elements in the variable.
- Tells you how many nodes exist.
-
Closeness centrality
-
head( )
-
length( )
CorrectIncorrect -
Question 298 of 1443
298. Question
3. Match the models to the correlation they are displaying.
Sort elements
- Correlation = 1
- Correlation = 0
- Correlation = -1
CorrectIncorrect -
Question 299 of 1443
299. Question
3. Fill in the blank below.
-
In a relationship, the value of the dependent variable changes in a non-linear fashion.
CorrectIncorrect -
-
Question 300 of 1443
300. Question
3. Put the steps in order for accessing the Twitter API for free.
-
Go to the "Permissions" tab to grant read, write and access direct messages
-
Create a new application.
-
Go to Twitter.com/signup and create an account
-
Press the "Generate My Access Tokens" button and copy both the Access Token Secret and Access Token because you will need to enter these credentials into R later on
-
Use the "Keys and Access Tokens" tab to save your API Key and API Secret
CorrectIncorrect -
-
Question 301 of 1443
301. Question
CorrectIncorrect -
Question 302 of 1443
302. Question
2. Fill in the blank below.
-
Use the function when combining two data sets into one.
CorrectIncorrect -
-
Question 303 of 1443
303. Question
2. What should you keep in mind as you run a label propagation algorithm?
Select all that applyCorrectIncorrect -
Question 304 of 1443
304. Question
2. Fill in the blank below.
-
To make sure your images are reproducible, you can use the function.
CorrectIncorrect -
-
Question 305 of 1443
305. Question
3. Which of these functions are the "bare bones" of ggplot2?
Select all that applyCorrectIncorrect -
Question 306 of 1443
306. Question
3. Why do we invert the y-scale in the rCharts plot?
CorrectIncorrect -
Question 307 of 1443
307. Question
3. Why is it important to understand different data types?
Select all that applyCorrectIncorrect -
Question 308 of 1443
308. Question
4. Why do we look at correlations between players' salaries and player statistics?
CorrectIncorrect -
Question 309 of 1443
309. Question
5. Fill in the blank.
-
To avoid falsely concluding that one event caused another, a possible method to use is .
CorrectIncorrect -
-
Question 310 of 1443
310. Question
5. A company is planning to re-brand one of its products and the product director wants to know how customers feel about some potential product names. Text mining can be most beneficial in which of these situations?
CorrectIncorrect -
Question 311 of 1443
311. Question
4. Which of these are examples of product recommendations?
Select all that applyCorrectIncorrect -
Question 312 of 1443
312. Question
4. Match each data quality with its description.
Sort elements
- The data was recorded correctly
- All relevant data was recorded
- Entities are recorded once
- The data is kept up to date
- The data agrees with itself
-
Accuracy
-
Completeness
-
Uniqueness
-
Timeliness
-
Consistency
CorrectIncorrect -
Question 313 of 1443
313. Question
5. Using this network visualization, order the relationships based upon the strength of their connection. Put the strongest connection on top.
-
The relationship between A and B
-
The relationship between C and B
-
The relationship between A and C
-
The relationship between C and D
CorrectIncorrect -
-
Question 314 of 1443
314. Question
3. Which of these conditions would result in a high R-squared?
CorrectIncorrect -
Question 315 of 1443
315. Question
4. Fill in the blank below.
-
The package is great for reformatting data in order to visualize the data the way we want to.
CorrectIncorrect -
-
Question 316 of 1443
316. Question
4. Using the Capital Bikeshare data, what questions can we answer through regression analysis?
Select all that applyCorrectIncorrect -
Question 317 of 1443
317. Question
5. Match the methods of variable selection to the correct descriptions.
Sort elements
- Algorithm starts with a model of 0 variables and continues to add more variables based upon a specified measure
- Starts with a model of all variables, and removes variables based upon a specified measure
- Combination of forward and backward selection that starts with a model of 0 variables and adds variables, but can also remove variables based upon a specified measure
-
Forward selection
-
Backward selection
-
Step-wise selection
CorrectIncorrect -
Question 318 of 1443
318. Question
4. Match the regression analyses we have learned about to the correct visualization.
Sort elements
- Linear
- Multivariate
- Polynomial
- LOESS
CorrectIncorrect -
Question 319 of 1443
319. Question
5. Match the symbols to what they represent when calculating eigenvalues.
Sort elements
- a matrix, such as an adjacency matrix
- identity matrix of A
- an eigenvalue of matrix A
-
A
-
I
-
λ
CorrectIncorrect -
Question 320 of 1443
320. Question
3. Which package can you use to find the political data from the Sunlight Foundation?
CorrectIncorrect -
Question 321 of 1443
321. Question
4. How can you determine if the communities that were detected by label propagation are stable?
CorrectIncorrect -
Question 322 of 1443
322. Question
5. What R code would give me the information in the 3rd-6th rows of the crime data set?
CorrectIncorrect -
Question 323 of 1443
323. Question
5. Why is it advantageous to create interactive graphs for this data set?
Select all that applyCorrectIncorrect -
Question 324 of 1443
324. Question
Based on this decision tree, order the students based on the likelihood that they will be accepted into a graduate program.
-
Student with a 4.0 GPA and GRE score in the 70th percentile
-
Student with a GRE score in the 80th percentile and GPA less than 2.8
-
Student with a 3.8 GPA and GRE score in the 80th percentile
CorrectIncorrect -
-
Question 325 of 1443
325. Question
5. You finished building a predictive model. Which questions may people have about it?
Select all that applyCorrectIncorrect -
Question 326 of 1443
326. Question
5. When does the adjusted R squared increase?
CorrectIncorrect -
Question 327 of 1443
327. Question
5. Why does the space after the carat below matter?
"[^ [:graph:]]"
CorrectIncorrect -
Question 328 of 1443
328. Question
5. Which node has the highest PageRank value?
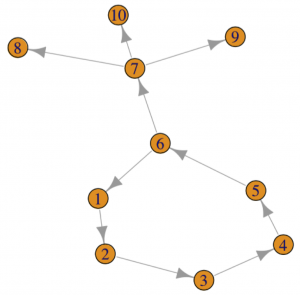 CorrectIncorrect
 -
Question 329 of 1443
329. Question
Good coding habits include:
Select all that applyCorrectIncorrect -
Question 330 of 1443
330. Question
Clustering is a form of what type of comparison?
CorrectIncorrect -
Question 331 of 1443
331. Question
What are views in SQL valuable for?
Select all that applyCorrectIncorrect -
Question 332 of 1443
332. Question
Put the steps of running a t-test in the correct order.
-
Build a new regression model based on each sample.
-
Use the standard deviation to calculate the p-value for the coefficient value in your regression model.
-
Take several samples of the data.
-
Measure how the coefficient of each variable changes.
CorrectIncorrect -
-
Question 333 of 1443
333. Question
Put the steps of k-NN in order.
-
Calculate distance from the point of interest to all other points
-
Perform a majority class vote based on the k nearest neighbors
-
Select k, the number of neighbors for the majority vote
CorrectIncorrect -
-
Question 334 of 1443
334. Question
Sort elements
- DROP
- INSERT
- UPDATE
- CASE
- DELETE
- CAST or CONVERT
-
Remove the entire table
-
Add a row for company ABC for 2005 to the table
-
Change the value 1,500 to 15,000
-
Return a conditional value (e.g. large company or small company) based on the number of employees
-
Remove the row with company ABC
-
Specify that a query return the employees field as an integer
CorrectIncorrect -
Question 335 of 1443
335. Question
Match the method to the description (note: there are more methods listed than necessary).
Sort elements
- Clustering
- Network analysis
- Text mining
- Forecasting
- Regression
-
Measures similarity between data points to group them and identify key similarities that you can use to find trends
-
Looks at how people, places, and other entities are connected, which can help you determine a sphere of influence and how to propagate your message quickly and effectively
-
Digests large amounts of text quickly and finds common themes, messages and patterns.
CorrectIncorrect -
Question 336 of 1443
336. Question
Fill in the blank below.
-
A big strength of the package is the ability to customize graphs by adding layers and adjusting the data so it doesn't look generic. This is a package that brings a lot of flexibility in visualizing your data beyond bar charts.
CorrectIncorrect -
-
Question 337 of 1443
337. Question
Match the models to the correlation they are displaying.
Sort elements
- Correlation = 1
- Correlation = 0
- Correlation = -1
CorrectIncorrect -
Question 338 of 1443
338. Question
Fill in the blank below:
-
In entropy, the number indicates 100% of the data is the same, and the number indicates a 50-50 split.
CorrectIncorrect -
-
Question 339 of 1443
339. Question
Match the function names to their descriptions.
Sort elements
- COUNTIF()
- SUMIF()
- AVERAGEIF()
- AND()
-
Counts the frequency of occurrence of data points that meet a specific condition
-
Sums up data across ranges that meet a specific condition
-
Takes an average of values across ranges that meet a specific condition
-
Helps you pick out records that meet a variety of conditions you set
CorrectIncorrect -
Question 340 of 1443
340. Question
Match the function names to their descriptions.
Sort elements
- COUNTIF()
- SUMIF()
- AVERAGEIF()
- AND()
-
Counts the frequency of occurrence of data points that meet a specific condition
-
Sums up data across ranges that meet a specific condition
-
Takes an average of values across ranges that meet a specific condition
-
Helps you pick out records that meet a variety of conditions you set
CorrectIncorrect -
Question 341 of 1443
341. Question
Fill in the blank below.
-
Clustering and data mining are types of data analysis , which is a type of data analysis where the intent is to see what the data can tell us beyond modeling or hypothesis testing.
CorrectIncorrect -
-
Question 342 of 1443
342. Question
Match the Plotly function to its symbol:
Sort elements
- Zoom
- Save as png
- Reset axis
- Auto scale
CorrectIncorrect -
Question 343 of 1443
343. Question
Match the confusion matrix term with the question that corresponds to it
Sort elements
- Accuracy
- Misclassification Rate
- Specificity
- Sensitivity/Precision
-
Overall, how often is the classifier correct?
-
Overall, how often is the classifier wrong?
-
How many actual negative outcomes were correctly predicted as negative?
-
How many actual positive outcomes were correctly predicted as positive?
CorrectIncorrect -
Question 344 of 1443
344. Question
What are some quick and easy-to-use visualizations that express frequency of words?
Please select all that applyCorrectIncorrect -
Question 345 of 1443
345. Question
Please fill in the blank below.
-
In perfect clustering, the silhouette value for each point will approach .
CorrectIncorrect -
-
Question 346 of 1443
346. Question
What are some use cases for the Jaccard Index?
Select all that applyCorrectIncorrect -
Question 347 of 1443
347. Question
Why do we need to validate the model?
CorrectIncorrect -
Question 348 of 1443
348. Question
Which of the answers below is a function?
Select all that applyCorrectIncorrect -
Question 349 of 1443
349. Question
Which two variables showed the strongest correlations with two clusters?
Select all that applyCorrectIncorrect -
Question 350 of 1443
350. Question
CorrectIncorrect -
Question 351 of 1443
351. Question
What does SQL stand for?
CorrectIncorrect -
Question 352 of 1443
352. Question
Which of the following statements is not true about k-means clustering?
Select all that applyCorrectIncorrect -
Question 353 of 1443
353. Question
What does it mean if your model has a smaller standard deviation of residuals?
CorrectIncorrect -
Question 354 of 1443
354. Question
What is one of the most effective methods for tuning an algorithm?
CorrectIncorrect -
Question 355 of 1443
355. Question
Why is it useful to audit your formulas?
CorrectIncorrect -
Question 356 of 1443
356. Question
CorrectIncorrect -
Question 357 of 1443
357. Question
Which of the following statements is not true about k-means clustering?
Select all that applyCorrectIncorrect -
Question 358 of 1443
358. Question
CorrectIncorrect -
Question 359 of 1443
359. Question
What is the range of outputs you can expect from a logistic regression model?
CorrectIncorrect -
Question 360 of 1443
360. Question
What happens when you have a higher degree polynomial model?
CorrectIncorrect -
Question 361 of 1443
361. Question
Which of these are common smoothing techniques?
Please select all that applyCorrectIncorrect -
Question 362 of 1443
362. Question
Which of these are examples of clustering?
Select all that applyCorrectIncorrect -
Question 363 of 1443
363. Question
Which package can you use to convert HTML into a readable list?
CorrectIncorrect -
Question 364 of 1443
364. Question
Fill in the blank.
-
Classification is a method that the behavior of an object or individual.
CorrectIncorrect -
-
Question 365 of 1443
365. Question
Sort elements
- Dependent variable
- Independent variable
- Slope of the line
- Y-intercept
-
Y
-
X
-
M
-
B
CorrectIncorrect -
Question 366 of 1443
366. Question
1. The first component ggplot2 starts with is the:
CorrectIncorrect -
Question 367 of 1443
367. Question
1. Which function pulls geographical information from Google?
CorrectIncorrect -
Question 368 of 1443
368. Question
2. Fill in the blank below.
-
In perfect clustering, the silhouette value for each point will approach .
CorrectIncorrect -
-
Question 369 of 1443
369. Question
1. Which of these questions may be most impacted by seasons or cycles?
CorrectIncorrect -
Question 370 of 1443
370. Question
2. Match the data science team structure with its pros and cons. In each situation the client, may represent either an internal or external team.
Sort elements
- Pros: Standardized processes + strategic goals/vision + client goals met
-
Pros: Client goals met
Cons: No strategic goals/vision met and Inconsistent & redundant processes -
Pros: Standardized processes + strategic goals/vision met
Cons: Client goals not met
CorrectIncorrect -
Question 371 of 1443
371. Question
2. Choose the correct pair of words to complete the statement.
The objective of a good model is not to fit the data perfectly, it's to have the lowest ___ when applied to new, _____ data.
CorrectIncorrect -
Question 372 of 1443
372. Question
1. Remember to always use this function to ensure that R is reading the data as characters before using the grep() function.
CorrectIncorrect -
Question 373 of 1443
373. Question
1. Which visualization below shows a trend with multiplicative seasonality?
CorrectIncorrect -
Question 374 of 1443
374. Question
1. Fill in the blank below.
-
The eigenvalue is essentially a number that can scale a matrix up and still maintain the of it.
CorrectIncorrect -
-
Question 375 of 1443
375. Question
1. What are two ways to identify clusters from the hclust function?
Select all that applyCorrectIncorrect -
Question 376 of 1443
376. Question
1. Match the names to the graphs below.
Sort elements
- Scatter plot
- Line graph
- Bar graph
- Histogram
CorrectIncorrect -
Question 377 of 1443
377. Question
2. Match the map pictures to the type
Sort elements
- Satellite
- Roadmap
- Terrain
- Hybrid
CorrectIncorrect -
Question 378 of 1443
378. Question
2. Match the picture type to the tile type
Sort elements
- "Stamen.Toner"
- "Stamen.Watercolor"
- "Esri.WorldImagery"
CorrectIncorrect -
Question 379 of 1443
379. Question
3. Fill in the blank below.
-
distance measures the distance between points by taking the cosine of the angle between them, which measures the similarity between those points both based on the attributes they have and the difference between the attributes they don't have.
CorrectIncorrect -
-
Question 380 of 1443
380. Question
2. Order the steps needed to build a multivariate regression model.
-
Run a regression analysis
-
Refine your model
-
Decide what you want to predict
-
Check your test statistics to see measures of accuracy, correlation, and error
-
Identify variables and data you think will influence the prediction
CorrectIncorrect -
-
Question 381 of 1443
381. Question
2. Which of the following is a practical challenge that companies face when using data?
CorrectIncorrect -
Question 382 of 1443
382. Question
2. Match the network to the possible connections.
Sort elements
- followers
- friends
- co-stars
- alma mater
- emails
- what grocery store you go to
-
Twitter
-
Facebook
-
Netflix catalog
-
Past presidents
-
Your company
-
City
CorrectIncorrect -
Question 383 of 1443
383. Question
3. Fill in the blank below.
-
Since seasonality and cycles affect forecasts and it is easier to predict outcomes than long-term outcomes - timing always matters when building predictive models.
CorrectIncorrect -
-
Question 384 of 1443
384. Question
3. Put the steps in order for testing the resilience of a network.
-
Find the most connected nodes and remove them from the data set
-
Remove the nodes with the least amount of connectedness and then plot the network again.
-
Plot the data again without those nodes.
CorrectIncorrect -
-
Question 385 of 1443
385. Question
2. What is TRUE about correlation?
Select all that applyCorrectIncorrect -
Question 386 of 1443
386. Question
2. Match the seasonality analysis use case questions to the business function they relate to.
Sort elements
- What features do we expect customers to like depending on season, time, etc.?
- How much will prices increase on construction supplies next fall?
- How many skis should Head expect to sell next winter?
- How much energy will be consumed in the middle of the day?
- How many newspapers will be sold on Sunday?
-
Research & Development
-
Buy
-
Make
-
Ship
-
Sell
CorrectIncorrect -
Question 387 of 1443
387. Question
2. Match the functions below to the actions they perform.
Sort elements
- creates a text string
- converts the text into an expression that can be manipulated, used in a calculation, etc.
- evaluates the expression
-
paste0()
-
parse()
-
eval()
CorrectIncorrect -
Question 388 of 1443
388. Question
2. Match the questions to the 3 or 4 states that someone can have when considering disease spread.
Sort elements
- What is the probability of infection for someone who is susceptible?
- What is the duration of infection?
- Why does someone recover?
- Why does someone become susceptible to disease again?
-
Susceptible to infection
-
Infected
-
Recovered
-
Susceptible to infection – again
CorrectIncorrect -
Question 389 of 1443
389. Question
3. Which function allows you to remove duplicate data from your data set?
CorrectIncorrect -
Question 390 of 1443
390. Question
3. What are some additional parameters you can use for label propagation?
Select all that applyCorrectIncorrect -
Question 391 of 1443
391. Question
3. How can you check the warnings to see if there is anything you should be concerned about?
CorrectIncorrect -
Question 392 of 1443
392. Question
4. Fill in the blank below.
-
The function allows you to save graphs in pdf or png formats.
CorrectIncorrect -
-
Question 393 of 1443
393. Question
4. Fill in the blank below
-
The term refers to data in quotation marks - the gsub() function manipulates and replaces patterns in this term.
CorrectIncorrect -
-
Question 394 of 1443
394. Question
4. What can you type into RStudio to find more information about a function?
Select all that applyCorrectIncorrect -
Question 395 of 1443
395. Question
5. How can you ensure that your analysis is reproducible?
CorrectIncorrect -
Question 396 of 1443
396. Question
4. You analyzed your customer data and found it made sense to cluster your customers into three distinct categories. When visualizing the data you see that there are a couple of data points that look to be between clusters. What could you conclude?
CorrectIncorrect -
Question 397 of 1443
397. Question
3. Why might it be advantageous to analyze word combinations or phrases instead of single words when doing a sentiment analysis?
CorrectIncorrect -
Question 398 of 1443
398. Question
4. When Hewlett Packard started tracking a range of employee factors, what were the results?
Select all that applyCorrectIncorrect -
Question 399 of 1443
399. Question
5. The datasets graphed all have similar summary statistics (including means and variances). What valuable lesson(s) can be learned from comparing the graphs?
CorrectIncorrect -
Question 400 of 1443
400. Question
4. Match the common relationships or patterns with the type of network they represent.
Sort elements
- Organizational relationships
- Communication patterns
- Economic, environmental, or geographic relationships
- Connections based on interests, preferences, or similarities
-
Manager and employee
-
Emails between co-workers
-
Citizens in the same tax bracket or state
-
Members of the same gym
CorrectIncorrect -
Question 401 of 1443
401. Question
4. What does S represent?
Select all that applyCorrectIncorrect -
Question 402 of 1443
402. Question
5. Complete the matrix below.
Sort elements
- Airports that likely serve as the entry points into the U.S. Passengers are likely arriving from abroad, then flying domestically throughout the U.S.
- Airports that likely serve as exit points out of the U.S. These are passengers arriving from domestic flights and then transferring to international flights leaving the country.
-
high out-degrees but low in-degrees
-
high in-degrees but low out-degrees
CorrectIncorrect -
Question 403 of 1443
403. Question
4. Which function adds a linear regression line to your model?
CorrectIncorrect -
Question 404 of 1443
404. Question
4. After running a Breusch-Pagan test, how would I know that there is no heteroscedasticity?
Select all that applyCorrectIncorrect -
Question 405 of 1443
405. Question
5. Match the Twitter terminology to the correct description.
Sort elements
- relates to topics mentioned by other users
- the user name of a person on Twitter
- signals the start of a user's Twitter handle
- friend or someone interested in what you have to say!
-
# (Hashtag)
-
Twitter handle
-
@ (at)
-
Follower
CorrectIncorrect -
Question 406 of 1443
406. Question
3. Why do we need to take the largest positive eigenvalue?
CorrectIncorrect -
Question 407 of 1443
407. Question
4. Which function allows you to read zip files?
CorrectIncorrect -
Question 408 of 1443
408. Question
4. Why is calculating PageRank so much faster than calculating eigenvector centrality?
CorrectIncorrect -
Question 409 of 1443
409. Question
4. What type of data does the grep() function work with?
CorrectIncorrect -
Question 410 of 1443
410. Question
5. What are some ways to save and display your rCharts plot?
Select all that applyCorrectIncorrect -
Question 411 of 1443
411. Question
5. Which question(s) can you answer with text analysis?
CorrectIncorrect -
Question 412 of 1443
412. Question
5. When detecting outliers, the chief goal is to:
CorrectIncorrect -
Question 413 of 1443
413. Question
5. Why is it important to remove multicollinearity?
CorrectIncorrect -
Question 414 of 1443
414. Question
5. Which function allows you to check the structure of a data set that you create?
CorrectIncorrect -
Question 415 of 1443
415. Question
5. Which function can remove "<>" from the data?
CorrectIncorrect -
Question 416 of 1443
416. Question
Match the function to its purpose.
Sort elements
- searches for text in data
- gives you the length of any vector
- tabulates the number of entries for categorical data
- sorts data by a particular column
-
grep()
-
length()
-
table()
-
order()
CorrectIncorrect -
Question 417 of 1443
417. Question
Fill in the blank below.
-
is a measure of the extent to which an increase in one variable corresponds to the increase in another variable. This does not imply causation, which determines whether or not a variable causes the effect on another variable - rather, it determines whether or not there is any connection between the variables that we can quantify.
CorrectIncorrect -
-
Question 418 of 1443
418. Question
Can a table in SQL be joined to itself? (True/False)
CorrectIncorrect -
Question 419 of 1443
419. Question
How do you calculate R squared?
CorrectIncorrect -
Question 420 of 1443
420. Question
The aes layer contains:
CorrectIncorrect -
Question 421 of 1443
421. Question
Match the following terms to the correct definition:
Sort elements
- Pulls rows where the value of the joining field is present in both tables
- Pulls all rows from one table, and only the rows from the second table where the value of the joining field matches a value.
- Pulls all rows from both tables.
- Pulls all possible combinations of rows in all tables.
-
INNER JOIN
-
(LEFT or RIGHT) OUTER JOIN
-
FULL OUTER JOIN
-
CROSS JOIN
CorrectIncorrect -
Question 422 of 1443
422. Question
Fill in the blank below.
-
Clustering assumes that is a measure for similarity. In other words, data points that are “closer” together physically in a graph are probably more similar than data points that are farther apart.
CorrectIncorrect -
-
Question 423 of 1443
423. Question
Fill in the blank below.
-
The function shows us the structure of the data.
CorrectIncorrect -
-
Question 424 of 1443
424. Question
How do you measure the explanatory power of your predictive model?
CorrectIncorrect -
Question 425 of 1443
425. Question
How was Target able to identify their pregnant customers?
CorrectIncorrect -
Question 426 of 1443
426. Question
Please fill in the blank below.
-
The function can help you summarize your data in different ways with just a few clicks - this can be faster and more efficient than using VLOOKUP() and HLOOKUP().
CorrectIncorrect -
-
Question 427 of 1443
427. Question
Please fill in the blank below.
-
The function can help you summarize your data in different ways with just a few clicks - this can be faster and more efficient than using VLOOKUP() and HLOOKUP().
CorrectIncorrect -
-
Question 428 of 1443
428. Question
Fill in the blanks below.
-
The method is part of unsupervised machine learning and discovers new patterns or groups of data, while the method is part of supervised machine learning and assigns data points to known groups or categories.
CorrectIncorrect -
-
Question 429 of 1443
429. Question
Match the Leaflet functions to the descriptions below:
Sort elements
- leaflet()
- addTiles()
- geocode()
- addCircles()
-
This base function generates the relevant map objects
-
Creates the visual that defines the look and feel of the map. Many kinds of title are available
-
Pulls geographical information from Google Maps. Google limits the number of queries to 2500 per day, so use geocodeQueryCheck() to track how many you have used
-
Plot for latitude and longitude positions of all points in our data frame
CorrectIncorrect -
Question 430 of 1443
430. Question
What are some of the negative effects of adding as many variables as possible to our model?
Select all that applyCorrectIncorrect -
Question 431 of 1443
431. Question
Please put the steps in order for scraping text data from a webpage.
-
Convert to desired data type (e.g. character vector, String class, corpus object)
-
Proceed with text cleaning and analyses
-
Inspect the output format
-
Read in and save the contents of the page into a variable
-
Access web page(s) from R and inspect the page structure
CorrectIncorrect -
-
Question 432 of 1443
432. Question
In order to ensure that you don't mistake randomness for patterns, what do you need to do?
CorrectIncorrect -
Question 433 of 1443
433. Question
What are some reasons to use APIs?
Please select all that applyCorrectIncorrect -
Question 434 of 1443
434. Question
What is supervised machine learning?
CorrectIncorrect -
Question 435 of 1443
435. Question
Fill in the blank below.
-
You can create a by wrapping code in curly braces. This can help you streamline your code to perform multiple steps in one line, similar to a for() loop.
CorrectIncorrect -
-
Question 436 of 1443
436. Question
Why do we cluster the basketball data with 3 clusters after we analyze it with 2 clusters?
CorrectIncorrect -
Question 437 of 1443
437. Question
When running a variable selection model, how does the computer know when it has found the right variables?
CorrectIncorrect -
Question 438 of 1443
438. Question
Why do we use packages for data manipulation instead of just using built-in R functions?
Select all that applyCorrectIncorrect -
Question 439 of 1443
439. Question
Which function makes sure that the k-means analysis is reproducible?
CorrectIncorrect -
Question 440 of 1443
440. Question
Which function can you use to see the list of contents that your linear regression model produces?
CorrectIncorrect -
Question 441 of 1443
441. Question
What is the complexity parameter?
CorrectIncorrect -
Question 442 of 1443
442. Question
Which error appears for an invalid cell reference?
CorrectIncorrect -
Question 443 of 1443
443. Question
What happens as your model become more precise?
CorrectIncorrect -
Question 444 of 1443
444. Question
Why is clustering more powerful than visualizing?
Select all that applyCorrectIncorrect -
Question 445 of 1443
445. Question
Please fill in the blanks below:
-
adjustments affect what data is displayed, while adjustments affect how the data is displayed.
CorrectIncorrect -
-
Question 446 of 1443
446. Question
Which function can you use to run a logistic regression model?
CorrectIncorrect -
Question 447 of 1443
447. Question
Why is it important to remove multicollinearity?
CorrectIncorrect -
Question 448 of 1443
448. Question
Please fill in the blank below.
-
The interval of a regression line, or the standard error, tells you with a certain percentage certainty where the best fit line can be.
CorrectIncorrect -
-
Question 449 of 1443
449. Question
When should you use density-based clustering?
Please select all that applyCorrectIncorrect -
Question 450 of 1443
450. Question
1. Fill in the blank.
-
A connects points (nodes) by lines that represent relationships. By studying the interactions between people, places and events, you can determine how messages, ideas, and diseases spread and how a change in one thing can cause a cascading set of effects.
CorrectIncorrect -
-
Question 451 of 1443
451. Question
1. How can you make differentiate between categorical variables in a regression?
CorrectIncorrect -
Question 452 of 1443
452. Question
2. Fill in the blanks below.
-
Data can be , like temperature which increases incrementally and can be fluid, or , like country names that cannot be divided.
CorrectIncorrect -
-
Question 453 of 1443
453. Question
2. Drag the term to the box next to the correct description.
Sort elements
- Vector
- Matrix
- List
- Data frame
-
Collection of elements of the same type
-
Multiple rows and columns of the same data type
-
Collection of elements of different types
-
Multiple rows and columns of different data types
CorrectIncorrect -
Question 454 of 1443
454. Question
1. Which industries can benefit from using predictive analytics?
CorrectIncorrect -
Question 455 of 1443
455. Question
2. Choose the correct pair of words to complete the statement.
The objective of a good model is not to fit the data perfectly, it's to have the lowest ___ when applied to new, _____ data.
CorrectIncorrect -
Question 456 of 1443
456. Question
1. Which of the following data science skill areas are necessary, if an organization wants to use data to drive decision making?
Select all that applyCorrectIncorrect -
Question 457 of 1443
457. Question
1. Which of these questions may be most impacted by seasons or cycles?
Select all that applyCorrectIncorrect -
Question 458 of 1443
458. Question
1. Which questions will you be able to answer by the end of this course?
Select all that applyCorrectIncorrect -
Question 459 of 1443
459. Question
2. Fill in the blank below.
-
A interval is a range of possible values based on the standard deviation of the data.
CorrectIncorrect -
-
Question 460 of 1443
460. Question
1. Why do we define eigenvector centrality based on the number of followers that an account has?
CorrectIncorrect -
Question 461 of 1443
461. Question
1. What does modularity measure?
CorrectIncorrect -
Question 462 of 1443
462. Question
1. Which two functions do you need to save your image output as a PDF?
Select all that applyCorrectIncorrect -
Question 463 of 1443
463. Question
2. Which of the answers below is a function?
Select all that applyCorrectIncorrect -
Question 464 of 1443
464. Question
3. Fill in the blank below
-
are a common format for storing and manipulating geospatial data such as complex borders, polygons, and so on.
CorrectIncorrect -
-
Question 465 of 1443
465. Question
3. Match the function to the question.
Sort elements
- How do you optimize the design of your products?
- Where can your organization get the resources it needs to create its good or service?
- How can you ensure the quality of the product and forecast demand?
- How can you improve routes and identify the most efficient yet low cost strategy for the number of delivery vehicles and staff?
- Which people are you targeting with your advertising?
-
Research and Development
-
Procurement
-
Production
-
Shipment
-
Sales
CorrectIncorrect -
Question 466 of 1443
466. Question
3. Fill in the blank.
-
Since seasonality and cycles affect forecasts and it is easier to predict short-term outcomes than long-term outcomes - always matters when building predictive models.
CorrectIncorrect -
-
Question 467 of 1443
467. Question
2. What questions should you ask about your data?
Select all that applyCorrectIncorrect -
Question 468 of 1443
468. Question
3. Put the events in order to describe how an economic network may expand. Place the first event on top.
-
A company decides to build new a factory in town
-
The factory requires the presence of construction crews and equipment
-
New factories and stores are built to meet an increase in demand
-
The families of the construction crews spend money in the city
CorrectIncorrect -
-
Question 469 of 1443
469. Question
-
If you add the row and the row, then you get the observed data row.
CorrectIncorrect -
-
Question 470 of 1443
470. Question
2. Fill in the blank below.
-
The function tells R that you'll be working with the vertices or nodes of the graph, and encloses the graph data frame we created earlier.
CorrectIncorrect -
-
Question 471 of 1443
471. Question
3. Put the steps of running a t-test in the correct order.
-
Measure how the coefficient of each variable changes.
-
Build a new regression model based on each sample.
-
Take several samples of the data.
-
Use the standard deviation to calculate the p-value for the coefficient value in your regression model.
CorrectIncorrect -
-
Question 472 of 1443
472. Question
3. When do you need to do a logarithmic transformation?
CorrectIncorrect -
Question 473 of 1443
473. Question
3. Fill in the blank below.
-
Use the function to rename the columns of the files that you create.
CorrectIncorrect -
-
Question 474 of 1443
474. Question
3. What type of model is the example below?
Common cold: someone can catch a cold, recover, enjoy a period of immunity and then be susceptible to another cold.
CorrectIncorrect -
Question 475 of 1443
475. Question
3. Match these three formatting functions to the correct actions.
Sort elements
- converts any color to the 3-number color identifier
- converts the RBG colors to an hsv format that we can use to add transparency to the color
- adds the level of transparency using the alpha argument
-
col2rgb()
-
rgb2hsv()
-
hsv()
CorrectIncorrect -
Question 476 of 1443
476. Question
2. What was Google's main ingredient of its successful algorithm?
CorrectIncorrect -
Question 477 of 1443
477. Question
5. Which function calls up all the files in a folder for an overview?
CorrectIncorrect -
Question 478 of 1443
478. Question
5. If your data are not compelling at first,
Select all that applyCorrectIncorrect -
Question 479 of 1443
479. Question
4. What is the main reason to set the 'standalone' parameter to TRUE for saving an HTML file?
CorrectIncorrect -
Question 480 of 1443
480. Question
4. What are some qualities that make a good visualization?
Select all that applyCorrectIncorrect -
Question 481 of 1443
481. Question
5. How does industry knowledge help us understand our analysis?
CorrectIncorrect -
Question 482 of 1443
482. Question
Fill in the blank.
-
One of the benefits of is that you can evaluate many different factors or dimensions (more than humans can see) when looking for patterns.
CorrectIncorrect -
-
Question 483 of 1443
483. Question
4. Fill in the blank.
-
Ideas, such as sentiments about gun control or abortion, can be evaluated using sentiment analysis, a branch of text mining. To do this analysis you will need to use a scale that positions people on a according to the intensity of their feelings.
CorrectIncorrect -
-
Question 484 of 1443
484. Question
5. The example below is an example of which aspect of the 3 V's?
"1 flight of a Boeing 737 across the continental United States generates as much data as is stored in the U.S. Library of Congress."
CorrectIncorrect -
Question 485 of 1443
485. Question
3. You are looking to fill a data analyst position. The following descriptions of previous work experience were found in different resumes. Which resume should you continue reading?
CorrectIncorrect -
Question 486 of 1443
486. Question
5. There is a new employee starting at the firm. Using the graph of current employees, which employee do you predict the new employee will have the strongest ties with?
The new employee (CTO) majored in Literature and previously worked at Microsoft. They have one child and vacation every year in Jamaica. They will be located at the San Francisco office.
CorrectIncorrect -
Question 487 of 1443
487. Question
4. Fill in the blank below.
-
stands for locally weighted scatterplot smoothing and uses linear regression giving more weight to points closer to each point being fitted.
stands for local regression and fits a polynomial function to small segments of the data.
CorrectIncorrect -
-
Question 488 of 1443
488. Question
4. What conclusions were we able to draw from visualizing the network?
Select all that applyCorrectIncorrect -
Question 489 of 1443
489. Question
5. True or False. Once you have the results of your model you have conclusively determined the trend of the data and/or have an accurate representation of what is happening in the world.
CorrectIncorrect -
Question 490 of 1443
490. Question
4. You can use the predict() function to make predictions using the model that you developed. Put the prediction use cases below in order according to the business function it was used for.
-
Make: Life insurance companies predict the age of death in order to approve policies and set pricing
-
Ship: Energex (Australian utility) predicts 20 years of electricity demand growth to direct infrastructure investment
-
Sell: Harrah's Hotel and Casino in Las Vegas predicts how much a customer will spend over the years, estimating their lifetime value to the casino
-
R&D: As much as 40% of trading on the London Stock Exchange is estimated to be driven by trading algorithms
-
Buy: Ski manufacturers predict demand for skis each winter, stocking up on supplies
CorrectIncorrect -
-
Question 491 of 1443
491. Question
4. What is TRUE about Twitter?
Select all that applyCorrectIncorrect -
Question 492 of 1443
492. Question
CorrectIncorrect -
Question 493 of 1443
493. Question
4. Match the functions to the correct actions.
Sort elements
- saves the data set
- checks the structure of the data
- tells R what to do if a condition is not met
- checks the sum of the output
-
write.csv()
-
str()
-
ifelse()
-
sum()
CorrectIncorrect -
Question 494 of 1443
494. Question
4. What are some of the conclusions from the analysis we did on the political data set?
Select all that applyCorrectIncorrect -
Question 495 of 1443
495. Question
3. Why might bar graphs be misleading?
CorrectIncorrect -
Question 496 of 1443
496. Question
5. Which function results in an interactive slider?
CorrectIncorrect -
Question 497 of 1443
497. Question
5. You are creating a feedback survey to send your customers. You already know their zip code, education level, and age. Which additional survey item captures a different type of information and may add explanatory power to your model?
CorrectIncorrect -
Question 498 of 1443
498. Question
5. What should you keep in mind as you're developing and running your model?
Select all that applyCorrectIncorrect -
Question 499 of 1443
499. Question
CorrectIncorrect -
Question 500 of 1443
500. Question
5. Which function makes the output randomized?
CorrectIncorrect -
Question 501 of 1443
501. Question
6. Which of these safety tips are correct? Select all that apply.
CorrectIncorrect -
Question 502 of 1443
502. Question
Which type of data contain sets of categories?
CorrectIncorrect -
Question 503 of 1443
503. Question
How can you ensure that your analysis is reproducible?
CorrectIncorrect -
Question 504 of 1443
504. Question
Which of the following SQL functions can be used on text fields?
Select all that applyCorrectIncorrect -
Question 505 of 1443
505. Question
What are some important questions you have to ask in order to be comfortable with your model?
Select all that applyCorrectIncorrect -
Question 506 of 1443
506. Question
Match the function names to their descriptions.
Sort elements
- labs()
- coord_flip()
- facet_wrap()
- geom_area()
-
Sets labels for axes and title
-
Flips the axes of a graph
-
Splits up data by category to give smaller individual graphs
-
Creates an area plot
CorrectIncorrect -
Question 507 of 1443
507. Question
Sort elements
- SUM(Employees)
- MIN(Employees)
- LEN(Company)
- LEFT(Company,2)
- COUNT(*)
- SUBSTRING(Company,2,1)
-
Return the total number of Employees in the table
-
Return the smallest number of Employees in the table
-
Return the number of characters in the Company field
-
Return the first 2 characters of the Company field
-
Return the number of records in the table
-
Return the second character of the Company field
CorrectIncorrect -
Question 508 of 1443
508. Question
How does clustering help when there are more than 3 attributes in the data?
CorrectIncorrect -
Question 509 of 1443
509. Question
Fill in the blank below.
-
In graphics, the transparency argument is called , where 0 is entirely transparent, and the default of 1 is entirely opaque.
CorrectIncorrect -
-
Question 510 of 1443
510. Question
Match the terms to their definitions.
Sort elements
- Measure of how dispersed the data is
- Standardized measure of how dispersed the data is
- Check if there is bias in the data or the model
- Measure of linear relationship between variables (positive/negative)
- Measure of strength of linear relationship between variables (positive/negative)
- How a change in variable x will affect variable y
- % of variation in y that can be explained by the variation in x
- The probability that the pattern exists through random chance, in the absence of a relationship between variables
-
Variance
-
Standard deviation
-
Distribution and "normality"
-
Covariance
-
Correlation
-
Slope
-
R squared
-
p-values
CorrectIncorrect -
Question 511 of 1443
511. Question
Put the four steps of building a classification tree in order.
-
Conditional on the previous answer, select the next question
-
Create a new question branch after the previous one
-
Stop growing the tree when there is no more information gain
-
Ask the question with the most amount of information
CorrectIncorrect -
-
Question 512 of 1443
512. Question
What are descriptive statistics?
CorrectIncorrect -
Question 513 of 1443
513. Question
Please fill in the blank below.
-
In order to freeze a reference, you can use the .
CorrectIncorrect -
-
Question 514 of 1443
514. Question
Fill in the blank below.
-
The main goal of clustering is to intra-cluster distance (the distance between points in a cluster) and inter-cluster distance (the distance between clusters). This ensures that the clusters are as defined and separated as possible.
CorrectIncorrect -
-
Question 515 of 1443
515. Question
Please fill in the blank below:
-
, the data visualization expert, argues that the visualization presented initially to NASA did not make the dangers clear for the Challenger shuttle launch, which exploded shortly after launch.
CorrectIncorrect -
-
Question 516 of 1443
516. Question
What are some of the advantages of using LASSO over Ridge?
Please select all that applyCorrectIncorrect -
Question 517 of 1443
517. Question
Identify the seasonality time frames for each example.
Sort elements
- Hourly
- Daily
- Weekly
- Monthly
-
Patterns of TV commercials
-
Electricity use
-
Typical office hours
-
Cable bills
CorrectIncorrect -
Question 518 of 1443
518. Question
How might finding the purchase patterns of different groups help you with your customers?
Select all that applyCorrectIncorrect -
Question 519 of 1443
519. Question
Put the basics of making API calls in order.
-
Construct URI with API key and query parameters (if any)
-
The response received from the server
-
The request sent to the server
CorrectIncorrect -
-
Question 520 of 1443
520. Question
What is unsupervised machine learning?
CorrectIncorrect -
Question 521 of 1443
521. Question
Why do we need to validate the model?
CorrectIncorrect -
Question 522 of 1443
522. Question
How can we address the limitations of our analysis to see the data differently?
Select all that applyCorrectIncorrect -
Question 523 of 1443
523. Question
What does the Akaike Information Criterion (AIC) do?
Select all that applyCorrectIncorrect -
Question 524 of 1443
524. Question
What type of data does the grep() function work with?
CorrectIncorrect -
Question 525 of 1443
525. Question
What is an important step so that R can read numbers as categories?
CorrectIncorrect -
Question 526 of 1443
526. Question
Which picture below displays the standard error of a best fit line?
CorrectIncorrect -
Question 527 of 1443
527. Question
Which of these is not an attribute of classification?
Select all that applyCorrectIncorrect -
Question 528 of 1443
528. Question
Why should you avoid using pie charts when visualizing data?
CorrectIncorrect -
Question 529 of 1443
529. Question
Which standard delimiters can Excel identify to split text into multiple columns?
CorrectIncorrect -
Question 530 of 1443
530. Question
What is one of the dangers of increasing the number of clusters?
CorrectIncorrect -
Question 531 of 1443
531. Question
Which function can you use to check the number of queries you have left for geocode()?
Note: Google limits your queries to 2500 per day, so make to check this if you are going to be geocoding a lot of data points.CorrectIncorrect -
Question 532 of 1443
532. Question
Why do we want to minimize false negatives in the bank marketing example?
CorrectIncorrect -
Question 533 of 1443
533. Question
What is multicollinearity?
CorrectIncorrect -
Question 534 of 1443
534. Question
What does it mean if you have a small p-value?
CorrectIncorrect -
Question 535 of 1443
535. Question
What inputs do you need to give to dbscan()?
Please select all that applyCorrectIncorrect -
Question 536 of 1443
536. Question
1. Classify the each document into one of these three categories: Talent, Research and development, Budget.
Sort elements
- Talent
- Budget
- Research and development
- Budget
- Research and development
- Talent
-
Meeting minutes on recruitment
-
Meeting minutes on expenditures
-
Meeting minutes on A/B testing
-
Meeting minutes on new vendors
CorrectIncorrect -
Question 537 of 1443
537. Question
1. Fill in the blank below.
-
Highly unusual data and other anomalies in a data set are called .
CorrectIncorrect -
-
Question 538 of 1443
538. Question
1. How much experience do you have in Excel?
-
Never used it before I'm an expert
CorrectIncorrect -
-
Question 539 of 1443
539. Question
1. Why is it important to format the axes correctly?
Select all that applyCorrectIncorrect -
Question 540 of 1443
540. Question
1. Drag the description into the box next to the appropriate term.
Sort elements
- whole number
- number with decimals
- data type written out in words
- either TRUE or FALSE
- variable that can be assigned value
-
Integer
-
Double
-
String/characters
-
Boolean/logicals
-
Factor
CorrectIncorrect -
Question 541 of 1443
541. Question
1. Match the reason data are valuable with its description.
Sort elements
- Maintaining accurate and secure data for a long period of time may help prove accountability and avoid penalties.
- Through the use of data, processes that were previously manual may be made more efficient.
- Descriptive statistics can reveal what has already happened and may provide surface-level insights.
- The use of data science methods can help extract novel, powerful insights, anticipate behaviors, and build tools.
-
Compliance
-
Automation
-
Dashboards
-
Predictive analytics
CorrectIncorrect -
Question 542 of 1443
542. Question
2. If the average high temperature in January is 40- 50 degrees Fahrenheit, order the temperatures with the temperatures that are most likely outliers at the top and the temperatures that are least likely outliers at the bottom.
-
40 degrees
-
45 degrees
-
63 degrees
-
22 degrees
CorrectIncorrect -
-
Question 543 of 1443
543. Question
1. What does every row in the customer data set represent?
CorrectIncorrect -
Question 544 of 1443
544. Question
2. If the average high temperature in January is 40- 50 degrees Fahrenheit, order the temperatures with the temperatures that are most likely outliers at the top and the temperatures that are least likely outliers at the bottom.
-
63 degrees
-
22 degrees
-
45 degrees
-
40 degrees
CorrectIncorrect -
-
Question 545 of 1443
545. Question
1. Fill in the blank below.
-
Regression is a model that captures the between two or more variables.
CorrectIncorrect -
-
Question 546 of 1443
546. Question
2. Fill in the blank below.
-
stands for LOcal regrESSion, which is a black box method that fits a polynomial function to small segments of the data.
CorrectIncorrect -
-
Question 547 of 1443
547. Question
1. What are some examples that prove what happens to one node can happen to other nodes in a network?
Select all that applyCorrectIncorrect -
Question 548 of 1443
548. Question
2. Please fill in the blanks below:
-
If two nodes are in the same community, then their delta is equal to , otherwise it’s equal to .
CorrectIncorrect -
-
Question 549 of 1443
549. Question
2. What are two ways to import data from your computer into RStudio?
Select all that applyCorrectIncorrect -
Question 550 of 1443
550. Question
2. Fill in the blank below.
-
R is a powerful tool for because the graphics tie in with the functions used to analyze data
CorrectIncorrect -
-
Question 551 of 1443
551. Question
3. Fill in the blank below.
-
The merge() function or join() function can be used to combine two .
CorrectIncorrect -
-
Question 552 of 1443
552. Question
2. Please fill in the blank below.
-
When recognized and credentialed experts incorrectly predict outcomes, they may claim that despite poor results, their reasoning was sound or there were poorly timed serendipitous events. Greater can help ensure incorrect predictions have real consequences.
CorrectIncorrect -
-
Question 553 of 1443
553. Question
3. To do outlier detection you need:
CorrectIncorrect -
Question 554 of 1443
554. Question
3. Put the steps of the data chain in order.
-
Visualization
-
Storage
-
Analysis
-
Acquisition
-
Cleaning
CorrectIncorrect -
-
Question 555 of 1443
555. Question
3. What is an adjacency matrix?
CorrectIncorrect -
Question 556 of 1443
556. Question
3. To do outlier detection, you need:
Select all that applyCorrectIncorrect -
Question 557 of 1443
557. Question
2. Which symbol do you use to tell R that you are ending the use of your function()?
CorrectIncorrect -
Question 558 of 1443
558. Question
2. What does it mean if you have a small p-value?
CorrectIncorrect -
Question 559 of 1443
559. Question
2. Put the steps for standardizing scales in order.
-
For normally distributed data, this centers the data at 0 and gives it a standard deviation of 1
-
Divide each observation by the standard deviation of the data
-
Subtract the mean from each observation type
CorrectIncorrect -
-
Question 560 of 1443
560. Question
2. Fill in the blank below.
-
You can remove punctuation in your data with the function.
CorrectIncorrect -
-
Question 561 of 1443
561. Question
2. Match the steps in identifying message diffusion to the correct image.
Sort elements
- 1. Identify the point where the message originates from.
- 2. Find the neighbors (direct connections) of original point
- 3. Run the algorithm that uses the probability/parameters to determine which (if any) neighbors receive the message
- 4. Recalculate the algorithm on the neighbors of the points who received the message
- 5. Continue until the parameters you set have been met
CorrectIncorrect -
Question 562 of 1443
562. Question
2. Which code below can be used to remove the record in the 312th row of data?
CorrectIncorrect -
Question 563 of 1443
563. Question
3. Please fill in the blank below:
-
The sum of all PageRank values for a network is .
CorrectIncorrect -
-
Question 564 of 1443
564. Question
4. Fill in the blank below.
-
is a programming term that means "named"; we use this term to indicate that data has been input into the R environment.
CorrectIncorrect -
-
Question 565 of 1443
565. Question
4. Why did the linear model line break into 5 different ribbons with the "fill = Continent" code?
CorrectIncorrect -
Question 566 of 1443
566. Question
4. Which function enables the display size to adjust to the size of the browser window?
CorrectIncorrect -
Question 567 of 1443
567. Question
5. Interactive visualization allows users to:
Select all that applyCorrectIncorrect -
Question 568 of 1443
568. Question
4. How can we address the limitations of our analysis to see the data differently?
Select all that applyCorrectIncorrect -
Question 569 of 1443
569. Question
3. You already have a successful business in Philadelphia. You want to expand into another, similar city. Use the visualization to help determine what city you should launch in next.
CorrectIncorrect -
Question 570 of 1443
570. Question
5. If you wanted to replicate the case study on Newton and extract political dispositions among Twitter users, order the steps you would take.
-
Collect data from Twitter
-
Sort tweets according to topic
-
Use domain knowledge to interpret the results
-
Visualize frequency of tweets on each topic
CorrectIncorrect -
-
Question 571 of 1443
571. Question
4. The 3 V's of data are:
Select all that applyCorrectIncorrect -
Question 572 of 1443
572. Question
5. Fill in the missing words.
-
5. Accountability is important to consider prior to launching a data science project.
Accountability: a clear project owner and the key stakeholders of the project need to be clearly defined – and this depends on the project. It may be the or another C-suite executive such as the Chief Data Scientist.
CorrectIncorrect -
-
Question 573 of 1443
573. Question
CorrectIncorrect -
Question 574 of 1443
574. Question
5. Identify the seasonality time frames for each example.
Sort elements
- Hourly
- Daily
- Weekly
- Monthly
-
Patterns of TV commercials
-
Electricity use
-
Typical office hours
-
Cable bills
CorrectIncorrect -
Question 575 of 1443
575. Question
4. Which calculation does the "closeness" function in the igraph package perform?
CorrectIncorrect -
Question 576 of 1443
576. Question
4. What does it mean if your model has a smaller standard deviation of residuals?
CorrectIncorrect -
Question 577 of 1443
577. Question
5. Match the key terms below to their descriptions.
Sort elements
- Check if there is bias in the data or the model
- The probability that the pattern exists through random chance
- Test for multicollinearity and independent variable interaction
- Check the residuals for heteroscedasticity (pattern contingent on fitted values)
- Check for information loss when selecting the right model for your data
-
Q-Q plot/ distribution of errors
-
p-values
-
VIF
-
Breusch-Pagan test
-
AIC
CorrectIncorrect -
Question 578 of 1443
578. Question
4. Which function lets you see how many calls you have left from the Twitter API?
CorrectIncorrect -
Question 579 of 1443
579. Question
3. Why is sorting your data by betweenness and eigenvector centrality based on the number of followers helpful?
CorrectIncorrect -
Question 580 of 1443
580. Question
4. Fill in the blank below.
-
stands for Hue, Saturation, and Value.
CorrectIncorrect -
-
Question 581 of 1443
581. Question
5. How can a politician use these metrics to help with their fundraising?
CorrectIncorrect -
Question 582 of 1443
582. Question
4. Visualization is an iterative process. Put the steps in order starting with "Analyze"
-
Graph
-
Repeat
-
Manipulate
-
Analyze
CorrectIncorrect -
-
Question 583 of 1443
583. Question
5. Which part of the "Simple App" application is the user input?
CorrectIncorrect -
Question 584 of 1443
584. Question
5. You finished building a predictive model. Which questions may people have about it?
CorrectIncorrect -
Question 585 of 1443
585. Question
5. Why is it important to sanity check yourself before you move on to the next step of your analysis?
Select all that applyCorrectIncorrect -
Question 586 of 1443
586. Question
5. Which visualizations below show time-series analysis?
Select all that applyCorrectIncorrect -
Question 587 of 1443
587. Question
5. What conclusions can be drawn from the visualization below showing cumulative dispersion of Tweets over time?
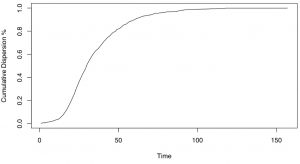
Select all that applyCorrectIncorrect -
Question 588 of 1443
588. Question
7. When should you report a needlestick injury to your regional manager?
CorrectIncorrect -
Question 589 of 1443
589. Question
Which operator pulls rows that contain specified terms you're searching for to create a new dataset with only those rows?
CorrectIncorrect -
Question 590 of 1443
590. Question
What are some conclusions we see when we graph points per game by minutes per game with three clusters?
Select all that applyCorrectIncorrect -
Question 591 of 1443
591. Question
Order these logical operators from fastest to slowest in terms of query performance:
-
>,>=,<,<=
-
=
-
LIKE
-
<>
CorrectIncorrect -
-
Question 592 of 1443
592. Question
After running a Breusch-Pagan test, how would you know that there is no heteroscedasticity?
Select all that applyCorrectIncorrect -
Question 593 of 1443
593. Question
Fill in the blank below.
-
The 'gg' in ggplot2 stands for .
CorrectIncorrect -
-
Question 594 of 1443
594. Question
Table: Company_Employees
Which SQL code will result in a frequency distribution of the Company field?
CorrectIncorrect -
Question 595 of 1443
595. Question
Match the terms to the descriptions.
Sort elements
- Betweenss
- Withinss
- Totss
-
Sum of all the squared distances between data points in different clusters
-
Sum of all the squared distances between points within the same cluster
-
Total sum of squares
CorrectIncorrect -
Question 596 of 1443
596. Question
Fill in the blanks below.
CorrectIncorrect -
Question 597 of 1443
597. Question
What do you need to run an F-test?
Select all that applyCorrectIncorrect -
Question 598 of 1443
598. Question
Match the attributes to the decision tree calculation.
Sort elements
- Entropy
- Gini impurity
-
Categorical attributes
Finds the largest class in the data
Uses algorithms
-
Continuous variables
Finds groups of classes that make up over 50% of their data
Minimizes classification
CorrectIncorrect -
Question 599 of 1443
599. Question
Match the description to the statistics term
Sort elements
- Mean
- Mode
- Median
- Variance
-
The average value you should expect to get out of a set of numbers
-
The number that occurs most frequently in a data set
-
The middle value when a set of numbers is arranged in either a decreasing or increasing order
-
Measures the dispersion of the data
CorrectIncorrect -
Question 600 of 1443
600. Question
What do What-If analysis tools do?
CorrectIncorrect -
Question 601 of 1443
601. Question
Fill in the blank below.
CorrectIncorrect -
Question 602 of 1443
602. Question
What are some aspects of a good visualization?
Please select all that applyCorrectIncorrect -
Question 603 of 1443
603. Question
Please fill in the blank below
-
Group learning is called learning, and is made up of many 'weak learners', which is the term for a classification algorithm that performs better than random chance. This type of approach to classification trees is called a random forest.
CorrectIncorrect -
-
Question 604 of 1443
604. Question
Match the types of time series analyses to their descriptions.
Sort elements
- Spectral analysis
- Wavelet analysis
- Auto-correlation
- Cross-correlation
-
Analyzes how time-series data can decompose into different frequencies that constitute underlying patterns
-
Studies wave patterns used to extract information from audio signals and images
-
The delayed correlation of a signal with itself (the past predicts the future)
-
Measures similarity between 2 different series and understands dependency between variables in the context of time
CorrectIncorrect -
Question 605 of 1443
605. Question
Please fill in the blank before.
-
DBSCAN uses a center-based approach to estimate for a particular point by counting the number of points present in a specified radius (eps) of that point.
CorrectIncorrect -
-
Question 606 of 1443
606. Question
What are some quick and easy-to-use visualizations that express frequency of words?
Please select all that applyCorrectIncorrect -
Question 607 of 1443
607. Question
Which of these is an example of exploratory data analysis?
CorrectIncorrect -
Question 608 of 1443
608. Question
What is supervised machine learning?
CorrectIncorrect -
Question 609 of 1443
609. Question
What does SQL stand for?
CorrectIncorrect -
Question 610 of 1443
610. Question
What is heteroscedasticity?
CorrectIncorrect -
Question 611 of 1443
611. Question
Which function eliminates duplicate rows?
CorrectIncorrect -
Question 612 of 1443
612. Question
Why is clustering more powerful than visualizing?
Select all that applyCorrectIncorrect -
Question 613 of 1443
613. Question
What is TRUE about correlation?
Select all that applyCorrectIncorrect -
Question 614 of 1443
614. Question
Which attribute does not belong to clustering?
Select all that applyCorrectIncorrect -
Question 615 of 1443
615. Question
What tab can you find the charting functionality in?
CorrectIncorrect -
Question 616 of 1443
616. Question
Which function would I use to change transform the text below to all capital letters?
coUpE --> COUPE
CorrectIncorrect -
Question 617 of 1443
617. Question
What is one of the most effective methods for tuning an algorithm?
CorrectIncorrect -
Question 618 of 1443
618. Question
Which piece of code will pass along the output from one function to the input of another function?
CorrectIncorrect -
Question 619 of 1443
619. Question
What type of regression offsets the inclusion of too many or irrelevant variables?
CorrectIncorrect -
Question 620 of 1443
620. Question
4. Which image below shows a polynomial regression?
CorrectIncorrect -
Question 621 of 1443
621. Question
What type of approach is support vector machines?
CorrectIncorrect -
Question 622 of 1443
622. Question
Which function in R can help you scale your data?
CorrectIncorrect -
Question 623 of 1443
623. Question
1. Fill in the blank.
-
There are many methods for analyzing data. When forecasting or predicting future events, the two most common methods are classification and .
CorrectIncorrect -
-
Question 624 of 1443
624. Question
1. Fill in the blank below.
-
A is a web of connections.
CorrectIncorrect -
-
Question 625 of 1443
625. Question
1. How can you search for different types of visualizations ?
CorrectIncorrect -
Question 626 of 1443
626. Question
4. Fill in the blank below.
-
is a programming term that means "named"; we use this term to indicate that data has been input into the R environment.
CorrectIncorrect -
-
Question 627 of 1443
627. Question
1. Why might three dimensional graphs be a good visualization option?
Select all that applyCorrectIncorrect -
Question 628 of 1443
628. Question
2. According to Edward Tufte, what is one of the main reasons why the Challenger Space Shuttle was allowed to take off?
CorrectIncorrect -
Question 629 of 1443
629. Question
1. When using data you may encounter any of the challenges listed below. Match each challenge with its description.
Sort elements
- Having the right staff with the right skills
- Getting the right data, the right sample size, and statistical significance
- Using data that may not have been collected with your intended use in mind
- Putting all the pieces together to extract meaningful insights from your data and use them in a responsible way
-
Practical challenge
-
Epistemological challenge
-
Ethical challenge
-
Grand challenge
CorrectIncorrect -
Question 630 of 1443
630. Question
1. Match the opportunity for using data with its business function.
Sort elements
- How can you optimize the design of your products and decrease the development time?
- How can you decrease costs and optimize inventory levels?
- How do you ensure the quality of the product and forecast demand to ensure that you are not producing too few or too many goods?
- How can you ensure that you are optimizing routing and have the most efficient yet low cost strategy?
- How can you find customers for your products, which people should you target with your advertising, and how can you predict how much of your goods and services people will want?
-
R&D
-
Buy
-
Make
-
Ship
-
Sell
CorrectIncorrect -
Question 631 of 1443
631. Question
2. Fill in the blank below.
-
Classification is a method that the behavior of an object or individual so we can forecast future events.
CorrectIncorrect -
-
Question 632 of 1443
632. Question
1. Match the method to the questions below.
Sort elements
- Categorization (Clustering + Text Mining)
- Categorization (Classification)
- Regression
- Relationship Learning (Network Analysis)
- Regression
-
How do people group together based on preferences?
-
How can you anticipate what people will like?
-
How can you anticipate how much someone will buy?
-
How can you reach the maximum number of people most efficiently?
-
How can you predict overall sales?
CorrectIncorrect -
Question 633 of 1443
633. Question
1. Fill in the blank below.
-
To speed up our work and avoid running calculations on each data point manually, we can use the loop function, which performs a set of operations as many times as you tell it to.
CorrectIncorrect -
-
Question 634 of 1443
634. Question
1. Which questions can we use local regression to answer?
Select all that applyCorrectIncorrect -
Question 635 of 1443
635. Question
1. Put the steps in order that you go through in R to understand message diffusion.
-
Continue until the parameters you set have been met
-
Recalculate the algorithm on the neighbors of the points who received the message
-
Find the neighbors (direct connections) of original point
-
Run the algorithm that uses the probability/parameters to determine which (if any) neighbors receive the message
-
Identify the point where the message originates from
CorrectIncorrect -
-
Question 636 of 1443
636. Question
CorrectIncorrect -
Question 637 of 1443
637. Question
3. What are two ways to load data from the Internet into RStudio?
Select all that applyCorrectIncorrect -
Question 638 of 1443
638. Question
3. Fill in the blank below
-
Web pages today are - they constantly update as the relevant information changes.
CorrectIncorrect -
-
Question 639 of 1443
639. Question
2. Which of these functions can be used for applying functions to data frames?
CorrectIncorrect -
Question 640 of 1443
640. Question
2. What is Big Data?
CorrectIncorrect -
Question 641 of 1443
641. Question
3. Fill in the missing word.
-
Some of the most interesting data generated and publicly available today can be accessed through something called an . Instead of downloading finite-sized excel spreadsheets or data sets, it allows you direct access to a database. You don’t have to download all of it, you can query for the sections and types of data you want or syphon data at a much higher speed than a regular download.
CorrectIncorrect -
-
Question 642 of 1443
642. Question
2. Which task can take up a considerable amount of a data scientist's time?
CorrectIncorrect -
Question 643 of 1443
643. Question
3. Match each person in the network with their strength.
Sort elements
- Greatest ability to spread a message (degree centrality)
- Can reach the most people in the shortest amount of time (closeness centrality)
- Is a great connector (betweenness centrality)
-
A person with a lot of connections
-
A person whose average path to all others is shortest
-
A person with the most shortest paths
CorrectIncorrect -
Question 644 of 1443
644. Question
2. Match the networks to their network analysis use cases.
Sort elements
- Prevent or control the spread of disease.
- Support participation and contributions from many types of users.
- Provide immediate assistance to customers who have problems or complaints, and anticipate problems before they occur.
- Band together to better understand their communities and government, or take collective action.
-
Healthcare organizations
-
Websites
-
Businesses
-
Individuals
CorrectIncorrect -
Question 645 of 1443
645. Question
3. Fill in the blank below.
-
vertex_connectivity() can tell you how many need to be removed from a graph in order for any 2 nodes to become disconnected.
CorrectIncorrect -
-
Question 646 of 1443
646. Question
2. Fill in the blank below.
-
You can run the correlation analysis using the function .
CorrectIncorrect -
-
Question 647 of 1443
647. Question
3. What is the moving average?
CorrectIncorrect -
Question 648 of 1443
648. Question
2. Fill in the blank below.
-
The package contains nice, pre-set color schemes that are useful when creating an interactive network visualization.
CorrectIncorrect -
-
Question 649 of 1443
649. Question
3. What does the "ego" function do?
CorrectIncorrect -
Question 650 of 1443
650. Question
2. Which statement below is TRUE?
CorrectIncorrect -
Question 651 of 1443
651. Question
2. Why might it be better to use the PageRank metric instead of the eigenvector metric for a large network?
Select all that applyCorrectIncorrect -
Question 652 of 1443
652. Question
3. Why do we use ‘==‘ instead of ‘=‘ to pull the day shift data?
CorrectIncorrect -
Question 653 of 1443
653. Question
4. Fill in the blank below.
-
The function adds a layer to a graph without having to create a data.frame and map it to the scales. This allows us to easily add text or other information right onto our visualization.
CorrectIncorrect -
-
Question 654 of 1443
654. Question
4. How do you stop the application from running?
CorrectIncorrect -
Question 655 of 1443
655. Question
3. While you may have access to big data, it does not mean that you have
CorrectIncorrect -
Question 656 of 1443
656. Question
3. Why can't we use View function to view the k-means results?
CorrectIncorrect -
Question 657 of 1443
657. Question
4. Ensemble learning, a concept in machine learning, happens when a group of learners are used together to arrive at a more accurate decision. Based on this concept, which Yelp! review would you consider when deciding whether or not to dine at a restaurant?
CorrectIncorrect -
Question 658 of 1443
658. Question
4. If you wanted to use text mining to know the road conditions, which source would you try using first?
CorrectIncorrect -
Question 659 of 1443
659. Question
3. Which of these is not a type of data?
CorrectIncorrect -
Question 660 of 1443
660. Question
4. When evaluating a work sample provided by a candidate for your data science team, which of these questions might you ask?
Select all that applyCorrectIncorrect -
Question 661 of 1443
661. Question
4. Which of the following is MOST characteristic of an opinion leader?
CorrectIncorrect -
Question 662 of 1443
662. Question
4. Match the situation with your next step.
Sort elements
- Next, you should run a regression analysis.
- Next, you should run a multivariate regression analysis.
- Next, you should run a polynomial regression analysis.
- Next, you should run a LOWESS or LOESS regression analysis.
-
You want to see how two variables interact.
-
You want to see how five variables interact.
-
You want to see if you can get a better fit with your five variables.
-
You want to see if your five variables are being influenced by seasonal changes.
CorrectIncorrect -
Question 663 of 1443
663. Question
4. ignore.case = TRUE is useful when
CorrectIncorrect -
Question 664 of 1443
664. Question
4. Which functions below allow you to compare your data set to a normal distribution and plot a bifurcating line on the graph?
Select all that applyCorrectIncorrect -
Question 665 of 1443
665. Question
4. Which image below shows a polynomial regression?
CorrectIncorrect -
Question 666 of 1443
666. Question
5. Match the searchTwitter() arguments to the correct functions.
Sort elements
- Search query to issue to twitter. Use "+" to separate query terms
- Maximum number of tweets to return
- Languages to use
- Earliest date to pull tweets, formatted as YYYY-MM-DD
- Latest date to pull tweets, formatted as YYYY-MM-DD
- Tweets by users located within a given radius of the given latitude/longitude
- Tweets with IDs greater (i.e. newer) than the specified ID
- Tweets with IDs smaller (i.e. older) than the specified ID
-
searchString
-
n
-
lang
-
since
-
until
-
geocode
-
sinceID
-
maxID
CorrectIncorrect -
Question 667 of 1443
667. Question
4. Why is it important to save dynamic plots as html files?
Select all that applyCorrectIncorrect -
Question 668 of 1443
668. Question
5. Match the functions to what they do.
Sort elements
- rename the columns
- renames the rows
- view the output
- save the output
-
colnames()
-
rownames()
-
view()
-
write.csv()
CorrectIncorrect -
Question 669 of 1443
669. Question
4. In order for the str_detect() function to work, what format does the data need to be in?
CorrectIncorrect -
Question 670 of 1443
670. Question
CorrectIncorrect -
Question 671 of 1443
671. Question
5. Why is the 'if(!require)' function used in the code below?
if (!require("devtools"))install.packages("devtools")devtools::install_github("rstudio/shinyapps")CorrectIncorrect -
Question 672 of 1443
672. Question
5. When detecting outliers, the chief goal is to:
CorrectIncorrect -
Question 673 of 1443
673. Question
5. What can we learn from the IBM case study?
CorrectIncorrect -
Question 674 of 1443
674. Question
5. Which function can help you identify periodicity quickly?
CorrectIncorrect -
Question 675 of 1443
675. Question
5. Which outputs do you get from the dispersion simulation?
Select all that applyCorrectIncorrect -
Question 676 of 1443
676. Question
1. Data science is at the intersection of which three domains?
CorrectIncorrect -
Question 677 of 1443
677. Question
Put the six Data Science control cycle steps in order, starting with “Ask”
-
Validate
-
Model
-
Test
-
Ask
-
Research
-
Interpret
CorrectIncorrect -
-
Question 678 of 1443
678. Question
How does industry knowledge help us understand our analysis?
CorrectIncorrect -
Question 679 of 1443
679. Question
Match the following SQL Server components to their definition
Sort elements
- programs that provides database services to other computer programs
- a container of data/information organized into tables (and other structures) so that they can be easily managed and accessed back in same fashion.
- data stored in a tabular format with rows of named columns
- An application used to configure, manage, and administer components of SQL server (i.e. the user interface for accessing servers, databases, and tables to launch commands to the server)
-
Server
-
Database
-
Table
-
SQL Server Management Studio
CorrectIncorrect -
Question 680 of 1443
680. Question
Match the methods of variable selection to the correct descriptions.
Sort elements
- Algorithm starts with a model of 0 variables and continues to add more variables based upon a specified measure
- Starts with a model of all variables, and removes variables based upon a specified measure
- Combination of forward and backward selection that starts with a model of 0 variables and adds variables, but can also remove variables based upon a specified measure
-
Forward selection
-
Backward selection
-
Step-wise selection
CorrectIncorrect -
Question 681 of 1443
681. Question
Identify the three things necessary to make a graph in ggplot2.
Select all that applyCorrectIncorrect -
Question 682 of 1443
682. Question
Match the table type to the statement that would create it:
Sort elements
- INTO ##TableName
- INTO #TableName
- INTO TableName
-
Global Temporary Table
-
Local Temporary Table
-
Permanent table
CorrectIncorrect -
Question 683 of 1443
683. Question
In order for us to determine how much variation our clusters account for, we need to:
CorrectIncorrect -
Question 684 of 1443
684. Question
Clustering is a form of what type of comparison?
CorrectIncorrect -
Question 685 of 1443
685. Question
Put the steps of running a t-test in the correct order.
-
Build a new regression model based on each sample.
-
Use the standard deviation to calculate the p-value for the coefficient value in your regression model.
-
Take several samples of the data.
-
Measure how the coefficient of each variable changes.
CorrectIncorrect -
-
Question 686 of 1443
686. Question
Put the steps of k-NN in order.
-
Select k, the number of neighbors for the majority vote
-
Perform a majority class vote based on the k nearest neighbors
-
Calculate distance from the point of interest to all other points
CorrectIncorrect -
-
Question 687 of 1443
687. Question
Please fill in the blank below.
CorrectIncorrect -
Question 688 of 1443
688. Question
Match the What-If analysis tool to its description:
Sort elements
- Goal Seek
- Scenario Manager
- Data Table
-
Determines how to get a desired result for a dependent variable within the analysis
-
Allows you to consider multiple combination of values for independent input variables in a analysis
-
Sees the effects of varying one or two variables in an analysis
CorrectIncorrect -
Question 689 of 1443
689. Question
Fill in the blank below:
-
In entropy, the number indicates 100% of the data is the same, and the number indicates a 50-50 split.
CorrectIncorrect -
-
Question 690 of 1443
690. Question
Please fill in the blanks below
-
Shiny applications have two basic components - the script, which defines the appearance of the app, and the script, which contains actions to perform based on user input.
CorrectIncorrect -
-
Question 691 of 1443
691. Question
Please put the flow of AdaBoost.M1 in order below.
-
Compute misclassification error
-
Compute new weights using adjustment term
-
Compute adjustment term
-
Run Classification Algorithm
-
Assign initial (equal weights to data points)
-
Run classification algorithm again and repeat
CorrectIncorrect -
-
Question 692 of 1443
692. Question
Please fill in the blank below.
-
The process of dividing the time series into its components is called - it divides it up into four components called level, trend, seasonality, and random error.
CorrectIncorrect -
-
Question 693 of 1443
693. Question
Please match the point names to the descriptions.
Sort elements
- Core points
- Border points
- Noise points
-
The points which are present in the interior of the dense region
-
The points which are present on the edge of a dense region
-
The points which are in a sparsely occupied region
CorrectIncorrect -
Question 694 of 1443
694. Question
Put the steps of simplified Luhn's method in order below:
-
Break up each document into sentences.
-
Select only sentences that are “important" for our summary
-
Get the list of the first n most frequently occurring words in the corpus
-
Select only the sentences whose indices were returned from the previous step
CorrectIncorrect -
-
Question 695 of 1443
695. Question
1. Why did we choose R programming language over other languages?
CorrectIncorrect -
Question 696 of 1443
696. Question
What is unsupervised machine learning?
CorrectIncorrect -
Question 697 of 1443
697. Question
Which functions below allow you to compare your data set to a normal distribution and plot a bifurcating line on the graph?
Select all that applyCorrectIncorrect -
Question 698 of 1443
698. Question
Which statement is not true if you receive a positive result from a cancer test that is 95% accurate with a base rate of 1 out of 5,000 people a month?
CorrectIncorrect -
Question 699 of 1443
699. Question
What would be the output of the following code for vector 'v':
v[2:7]
CorrectIncorrect -
Question 700 of 1443
700. Question
What is one of the dangers of increasing the number of clusters?
CorrectIncorrect -
Question 701 of 1443
701. Question
What is R Squared?
CorrectIncorrect -
Question 702 of 1443
702. Question
Which of these is not a strength of kNN?
Select all that applyCorrectIncorrect -
Question 703 of 1443
703. Question
Which of these is regression not designed to do?
Select all that applyCorrectIncorrect -
Question 704 of 1443
704. Question
Please fill in the blank below.
-
These two functions allow you to look up a value in a table, and return the desired value from another column in that table. The is for vertical tables, and the is for horizontal tables.
CorrectIncorrect -
-
Question 705 of 1443
705. Question
What is the complexity parameter?
CorrectIncorrect -
Question 706 of 1443
706. Question
Which analogy best describes the UI and server script?
CorrectIncorrect -
Question 707 of 1443
707. Question
What should you do before applying Ridge regressions?
CorrectIncorrect -
Question 708 of 1443
708. Question
What is a powerful R package you can use for text mining?
CorrectIncorrect -
Question 709 of 1443
709. Question
Which SVM classifier plots a 'worst-fit line'?
CorrectIncorrect -
Question 710 of 1443
710. Question
Which of the following are applications of principal component analysis?
Please select all that applyCorrectIncorrect -
Question 711 of 1443
711. Question
1. Fill in the blank.
-
regression is just like univariate or linear regression, but instead of using just two variables to build a model, it can factor in more variables when building the forecasting model.
CorrectIncorrect -
-
Question 712 of 1443
712. Question
1. Fill in the blank below.
-
plots intermediate points between two locations.
CorrectIncorrect -
-
Question 713 of 1443
713. Question
1. How does R determine whether two nodes belong in the same community?
CorrectIncorrect -
Question 714 of 1443
714. Question
1. Fill in the blank below.
-
is a term that means only looking at a portion of the data. It is denoted in R by a '$' symbol.
CorrectIncorrect -
-
Question 715 of 1443
715. Question
1. Which operator pulls rows that contain specified terms you're searching for to create a new dataset with only those rows?
CorrectIncorrect -
Question 716 of 1443
716. Question
2. When Hewlett Packard started tracking a range of employee factors, what were the results?
Select all that applyCorrectIncorrect -
Question 717 of 1443
717. Question
1. Put the steps of a data science project in order.
-
Storage- store and access data
-
Cleaning- re-format and check data for accuracy
-
Acquisition- acquire or collect data
-
Visualization- present your data
-
Analysis- analyze the data
CorrectIncorrect -
-
Question 718 of 1443
718. Question
1. Why did the Oakland A's 'Moneyball' strategy succeed?
CorrectIncorrect -
Question 719 of 1443
719. Question
1. What are some pitfalls of clustering?
Select all that applyCorrectIncorrect -
Question 720 of 1443
720. Question
2. How can you determine what people are interested in?
Select all that applyCorrectIncorrect -
Question 721 of 1443
721. Question
1. Fill in the blank below.
-
can have a very negative impact on linear regressions if they are not identified and handled properly.
CorrectIncorrect -
-
Question 722 of 1443
722. Question
1. What are some sanity check questions you should ask yourself when building regression models?
Select all that applyCorrectIncorrect -
Question 723 of 1443
723. Question
1. Which function allows you to select rows that you will keep in your data set?
CorrectIncorrect -
Question 724 of 1443
724. Question
2. What is the underlying concept of edge betweenness?
CorrectIncorrect -
Question 725 of 1443
725. Question
2. Which piece of code will retrieve only the third column of a matrix called 'm'?
CorrectIncorrect -
Question 726 of 1443
726. Question
2. Why is faceting the baseball plot not a good option?
Select all that applyCorrectIncorrect -
Question 727 of 1443
727. Question
3. Fill in the blank below.
-
data is also valuable for the initial exploratory data analysis.
CorrectIncorrect -
-
Question 728 of 1443
728. Question
2. Which of the following is a practical challenge that companies face when using data?
CorrectIncorrect -
Question 729 of 1443
729. Question
2. Which three words are used to describe Big Data?
Select all that applyCorrectIncorrect -
Question 730 of 1443
730. Question
3. Identify where in the data chain the issues below could be addressed.
NOTE: Preparing and visualizing data are often iterative processes and you should remember to "Sanity Checks" to ensure that you're continuing to move in the right direction.
Sort elements
- the maintenance of data quality
- your audience
- errors and outliers
-
When cleaning data, consider...
-
When visualizing data, consider...
-
When both cleaning and visualizing data, consider...
CorrectIncorrect -
Question 731 of 1443
731. Question
3. Fill in the blank below.
-
The Index measures similarity between people or places in a network. It’s a simple calculation that takes the number of things in common divided by the total unique number of things or connections that each node in the network has.
CorrectIncorrect -
-
Question 732 of 1443
732. Question
3. The best way to gain new insights about people and places is to
CorrectIncorrect -
Question 733 of 1443
733. Question
2. What is NOT an example of a regression analysis output you will create in this course?
CorrectIncorrect -
Question 734 of 1443
734. Question
2. Which package can you use to create a 3D plot?
CorrectIncorrect -
Question 735 of 1443
735. Question
2. Match the functions below to the correct actions.
Sort elements
- converts data into time series data
- calculates the seasonality factors in data
- compares the lagged difference in the residuals
- finds the periodicity
- runs a linear regression model
- calculates the moving average
-
ts()
-
decompose()
-
diff()
-
acf()
-
lm()
-
filter()
CorrectIncorrect -
Question 736 of 1443
736. Question
3. Match the arguments used to plot an interactive graph to what they do.
Sort elements
- defines the network structure
- determines the attributes of the nodes such as colors
- is where the edges start
- is where the edges go to
- is the thickness of the edges
- defines the names of the points
- defines the colors of the points
- determines the size of the node labels
- determines the transparency of the elements in the graph
- defines how zoomed in or out the graph is, positive to zoom in, negative to zoom out
-
Links =
-
Nodes =
-
Source =
-
Target =
-
Value =
-
NodeID =
-
Group =
-
fontSize =
-
opacity =
-
charge =
CorrectIncorrect -
Question 737 of 1443
737. Question
2. Fill in the blank below.
-
Use the function to ensure there are no duplicate records in your data.
CorrectIncorrect -
-
Question 738 of 1443
738. Question
3. How do you down-weight famous people and boost less famous ones?
CorrectIncorrect -
Question 739 of 1443
739. Question
3. Which function did we use to calculate the total number of donors for each legislator?
CorrectIncorrect -
Question 740 of 1443
740. Question
5. Fill in the blank below
-
In order to select specific values from our crime data, we first need to tell R that the
data we want to use is in a format.
CorrectIncorrect -
-
Question 741 of 1443
741. Question
4. When should you set the 'flip.y' argument equal to FALSE?
CorrectIncorrect -
Question 742 of 1443
742. Question
3. Which UI component adds a checkbox to the application?
CorrectIncorrect -
Question 743 of 1443
743. Question
4. The real value of more accurate information is in the
CorrectIncorrect -
Question 744 of 1443
744. Question
CorrectIncorrect -
Question 745 of 1443
745. Question
5. If you want to know how accurate your classification model is, what information do you need?
CorrectIncorrect -
Question 746 of 1443
746. Question
4. Label each aspect of the graph.
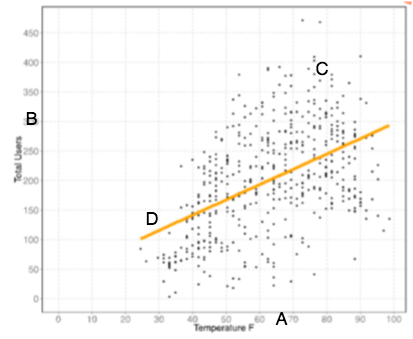
Sort elements
- regression line
- Actual data points
- independent variable
- dependent variable
-
D
-
C
-
A
-
B
CorrectIncorrect -
Question 747 of 1443
747. Question
4. What's new about Big Data?
CorrectIncorrect -
Question 748 of 1443
748. Question
4. Data science is at the intersection of which three domains?
CorrectIncorrect -
Question 749 of 1443
749. Question
5. Fill in the blank below.
-
centrality is a metric evaluates a node’s or a person’s importance by giving consideration to the importance of the nodes or people connected to it.
CorrectIncorrect -
-
Question 750 of 1443
750. Question
4. Which of the following are common causes of outliers?
Select all that applyCorrectIncorrect -
Question 751 of 1443
751. Question
5. The "-", or minus, symbol before the "grep" function tells R to
CorrectIncorrect -
Question 752 of 1443
752. Question
4. How does Cook's distance help to identify outliers that can skew your analysis?
CorrectIncorrect -
Question 753 of 1443
753. Question
5. How did we know our polynomial regression model was stronger than our linear regression model?
Select all that applyCorrectIncorrect -
Question 754 of 1443
754. Question
4. Which package do you need to load to use the setnames() function?
CorrectIncorrect -
Question 755 of 1443
755. Question
4. What are some things that infection can depend on?
Select all that applyCorrectIncorrect -
Question 756 of 1443
756. Question
4. What can a basic link prediction algorithm be used for?
Select all that applyCorrectIncorrect -
Question 757 of 1443
757. Question
5. Put the steps to extract an email address from an email in order.
-
Convert the e-mail files from an mbox format to an individual e-mail txt file format.
-
Remove extraneous characters from the rows you've selected.
-
Install and load the two packages to read in emails.
-
Select only the rows that contain the email address.
CorrectIncorrect -
-
Question 758 of 1443
758. Question
1. Data science is at the intersection of which three domains?
CorrectIncorrect -
Question 759 of 1443
759. Question
5. What should you keep in mind when scraping information?
Select all that applyCorrectIncorrect -
Question 760 of 1443
760. Question
Was this easy?
CorrectIncorrect -
Question 761 of 1443
761. Question
5. Which argument will determine the color of each region of the map?
CorrectIncorrect -
Question 762 of 1443
762. Question
5. What term do we use to refer the growth factor (slope of best fit line) that adjust the level (y-intercept of the best fit line)?
CorrectIncorrect -
Question 763 of 1443
763. Question
5. What are some ways that we can measure the relationship between 2 individuals?
Select all that applyCorrectIncorrect -
Question 764 of 1443
764. Question
2. Data scientists’ responsibilities may include:
CorrectIncorrect -
Question 765 of 1443
765. Question
Match the method to the description (note: there are more methods listed than necessary).
Sort elements
- Clustering
- Network analysis
- Text mining
- Forecasting
- Regression
-
Measures similarity between data points to group them and identify key similarities that you can use to find trends
-
Looks at how people, places, and other entities are connected, which can help you determine a sphere of influence and how to propagate your message quickly and effectively
-
Digests large amounts of text quickly and finds common themes, messages and patterns.
CorrectIncorrect -
Question 766 of 1443
766. Question
Which of these is not a common data problem?
CorrectIncorrect -
Question 767 of 1443
767. Question
Match the table combination types with their definitions:
Sort elements
- brings columns from 2 different tables into a combined table
- appends records from 2 tables into a combined table
-
JOIN
-
UNION
CorrectIncorrect -
Question 768 of 1443
768. Question
What are some key things you should always check for in your model?
Select all that applyCorrectIncorrect -
Question 769 of 1443
769. Question
Fill in the blank below.
CorrectIncorrect -
Question 770 of 1443
770. Question
What are views in SQL valuable for?
Select all that applyCorrectIncorrect -
Question 771 of 1443
771. Question
What are some conclusions from the visualization of Congress?
Select all that applyCorrectIncorrect -
Question 772 of 1443
772. Question
Fill in the blank below.
-
is a measure of the extent to which an increase in one variable corresponds to the increase in another variable. This does not imply causation, which determines whether or not a variable causes the effect on another variable - rather, it determines whether or not there is any connection between the variables that we can quantify.
CorrectIncorrect -
-
Question 773 of 1443
773. Question
How do you calculate R squared?
CorrectIncorrect -
Question 774 of 1443
774. Question
Put the six Data Science control cycle steps in order, starting with “Ask”
-
Validate
-
Interpret
-
Test
-
Ask
-
Model
-
Research
CorrectIncorrect -
-
Question 775 of 1443
775. Question
Match the correlation values to their meaning.
Sort elements
- 1
- -1
- 0
-
The variables move perfectly in tandem
-
The variables move in a perfectly inverse fashion
-
There is no linear relationship between the variance of the variables
CorrectIncorrect -
Question 776 of 1443
776. Question
Put the steps of Goal Seek in order, starting with Click on the "What-If Analysis Group" button.
-
Click on the What-If Analysis Group button
-
In the To value prompt, declare the target value that will be calculated in the Set cell location
-
If you wish to accept the new value, click OK
-
In the Set cell prompt, declare the cell that contains the formula that calculates the target value of interest
-
Click OK, Excel will overwrite the previous cell value with the new one
-
In the By changing cell prompt, declare the location of the model input that will be changed by the function
CorrectIncorrect -
-
Question 777 of 1443
777. Question
How was Target able to identify their pregnant customers?
CorrectIncorrect -
Question 778 of 1443
778. Question
Put the steps for creating a Shiny application in order by dragging them below.
-
Run the application
-
Build the server.R script
-
Create a new folder with the name of the application
-
Save the server.R script in the folder
-
Save the ui.R script in the folder
-
Build the ui.R script
CorrectIncorrect -
-
Question 779 of 1443
779. Question
What are some advantages of boosting?
Please select all that applyCorrectIncorrect -
Question 780 of 1443
780. Question
What is the name of the plot below that plots the autocorrelation function for different values of time lag?
CorrectIncorrect -
Question 781 of 1443
781. Question
Please put the steps of n-fold cross-validation in order
-
Repeat the process for every subset you create
-
Use each subset as the test data set and use the rest of the data as the training data set
-
Split the data set into several subsets ("n" number of subsets) of equal size
CorrectIncorrect -
-
Question 782 of 1443
782. Question
3. What does it mean to “practice” coding?
Select all that applyCorrectIncorrect -
Question 783 of 1443
783. Question
3. Fill in the blank below.
-
Excel's visualization capabilities can be limited by its menus. R does not have such a constraint. As a result, you can create beautiful, varied visualizations and make more nuanced changes with R than with Excel.
CorrectIncorrect -
-
Question 784 of 1443
784. Question
Which of these is an example of exploratory data analysis?
CorrectIncorrect -
Question 785 of 1443
785. Question
What does it mean if your model has a smaller standard deviation of residuals?
CorrectIncorrect -
Question 786 of 1443
786. Question
What function do you need to use to perform the k Nearest Neighbors algorithm?
CorrectIncorrect -
Question 787 of 1443
787. Question
Which piece of code will retrieve only the third column of a matrix called 'm'?
CorrectIncorrect -
Question 788 of 1443
788. Question
What types of data are difficult to cluster?
Select all that applyCorrectIncorrect -
Question 789 of 1443
789. Question
What does it mean if you have a small p-value?
CorrectIncorrect -
Question 790 of 1443
790. Question
Which one of these diagrams shows an entropy of 1?
CorrectIncorrect -
Question 791 of 1443
791. Question
What is the Analysis ToolPak?
CorrectIncorrect -
Question 792 of 1443
792. Question
Which function looks up a particular value in a table and produces the row in which the value is located?
CorrectIncorrect -
Question 793 of 1443
793. Question
Which of these is not an attribute of classification?
Select all that applyCorrectIncorrect -
Question 794 of 1443
794. Question
Which function enables the display size to adjust to the size of the browser window?
CorrectIncorrect -
Question 795 of 1443
795. Question
What is the only difference between the Ridge penalty and LASSO penalty?
CorrectIncorrect -
Question 796 of 1443
796. Question
Please fill in the blank below.
-
The term means "data about data". It contains context ("resource descriptions") for objects of interest, such as MP3 files, library books, or satellite images.
CorrectIncorrect -
-
Question 797 of 1443
797. Question
Please fill in the blank below.
-
The product is the sum of the products of all the same dimensions, while the product is the sum of the products of all the different dimensions.
CorrectIncorrect -
-
Question 798 of 1443
798. Question
Please fill in the blank below.
-
is used for dimensionality reduction of the data by decomposing a matrix into three different matrices.
CorrectIncorrect -
-
Question 799 of 1443
799. Question
1. Fill in the blank.
-
Highly unusual data and other anomalies in a data set are called .
CorrectIncorrect -
-
Question 800 of 1443
800. Question
1. Before combining data from two separate data sets using the "join" command it is important to
CorrectIncorrect -
Question 801 of 1443
801. Question
1. How can you make sure that R doesn't take the weights of a network graph into account?
CorrectIncorrect -
Question 802 of 1443
802. Question
1. Match the functions to the actions that they perform in R.
Sort elements
- sets up the network data
- checks the structure of the output
- pulls attributes of graph vertices
- pulls attributes of graph edges
-
graph.data.frame()
-
str()
-
V()
-
E()
CorrectIncorrect -
Question 803 of 1443
803. Question
1. Match the names to the graphs below.
Sort elements
- Scatter plot
- Line graph
- Bar graph
- Histogram
CorrectIncorrect -
Question 804 of 1443
804. Question
2. Fill in the blank below.
-
Clustering and data mining are types of data analysis.
CorrectIncorrect -
-
Question 805 of 1443
805. Question
2. Match each question with the best method for answering it.
Sort elements
- Clustering
- Classification
- Clustering
- Classification
- Clustering
- Classification
-
Based on their shopping history, what commonalities are there among our customers?
-
Based on a customer's shopping patterns, is it likely that this customer is pregnant?
-
What do people think about our brand?
-
Is it likely that this shopper will purchase our product?
-
When a disease spreads, are there any patterns in its spreading?
-
With the symptoms exhibited, what diagnosis might a doctor propose?
CorrectIncorrect -
Question 806 of 1443
806. Question
1. Put the 5 functions of an organization in order.
-
Production
-
Procurement
-
Sales
-
Shipment
-
Research and development
CorrectIncorrect -
-
Question 807 of 1443
807. Question
2. How do businesses use probabilistic algorithms?
Select all that applyCorrectIncorrect -
Question 808 of 1443
808. Question
1. Fill in the blank below.
-
Networks are not always obvious, they are in the vastness of increasing amounts of data collected today.
CorrectIncorrect -
-
Question 809 of 1443
809. Question
1. Which package helps us to visualize all the correlations in the data at once so we can get a better sense for the variables that may have the greatest predictive power?
CorrectIncorrect -
Question 810 of 1443
810. Question
2. Fill in the blank below.
-
Data is extracting information from large quantities of data to find insights, patterns and latent connections.
CorrectIncorrect -
-
Question 811 of 1443
811. Question
1. Which function counts the number of nodes (vertices) in a graph?
CorrectIncorrect -
Question 812 of 1443
812. Question
1. Put the five steps of label propagation in order.
-
Nodes having the same labels are all assigned to the same community.
-
At every subsequent step, each node adopts the most popular label amongst its neighbors.
-
As the labels propagate through the network, densely connected groups adopt the same label.
-
Label each node in a network with a unique label.
-
Nodes assume the labels of adjacent nodes that they’re connected to at random.
CorrectIncorrect -
-
Question 813 of 1443
813. Question
2. Which of the answers below is a function?
Select all that applyCorrectIncorrect -
Question 814 of 1443
814. Question
2. Which of these functions is similar to the 'search and replace' function in other programs?
CorrectIncorrect -
Question 815 of 1443
815. Question
3. Match the method to the description (note: there are more methods listed than necessary).
Sort elements
- Clustering
- Network analysis
- Text mining
- Forecasting
- Regression
-
Measures similarity between data points to group them and identify key similarities that you can use to find trends
-
Looks at how people, places, and other entities are connected, which can help you determine a sphere of influence and how to propagate your message quickly and effectively
-
Digests large amounts of text quickly and finds common themes, messages and patterns.
CorrectIncorrect -
Question 816 of 1443
816. Question
2. When categorizing observations, you should...
CorrectIncorrect -
Question 817 of 1443
817. Question
3. Data science teams produce two types of products - functional and one-off products. Match the type of product with the description.
Sort elements
- Functional product
- Functional product
- One-off product
- One-off product
- Not a data science team product
-
An interactive tool that is used repeatedly to gain new information
-
A tool that your client interacts with to get updated information
-
An analysis used to deliver information in a presentation
-
A visualization that supports a story
CorrectIncorrect -
Question 818 of 1443
818. Question
2. Put the steps of the functions of a business in order, starting with "Research and Development"
-
Research and Development: optimize design and decrease time
-
Buy: manage inventory
-
Make: ensure quality and gauge demand
-
Sell: target clients and suggest products
-
Ship: optimize route
CorrectIncorrect -
-
Question 819 of 1443
819. Question
2. What happened when Wal-Mart decided to combine the data from its loyalty card system with that from its point of sale systems?
CorrectIncorrect -
Question 820 of 1443
820. Question
2. Put the 5 similar functions of an organization in the correct order.
-
Research and development
-
Buy
-
Ship
-
Make
-
Sell
CorrectIncorrect -
-
Question 821 of 1443
821. Question
3. Fill in the blank below.
-
The key to staying current with your data analysis skills is to continue reading, and staying up to date with the latest tools and applications.
CorrectIncorrect -
-
Question 822 of 1443
822. Question
3. Match the arguments in 3D plotting to their actions.
Sort elements
- set the limits of the x-axis
- set the limits of the y-axis
- set the limits of the z-axis
- size of the points
- whether to display a box around the grid
- whether to display a grid between the x and y axes
- can be used to automatically create a color gradient
- adds vertical lines that lead to the points
- specifies what type of line should lead up to the points if type ="h"
- angle between the x and y axes
-
xlim
-
ylim
-
zlim
-
pch
-
box
-
grid
-
highlight.3d
-
type = "h"
-
lty.hplot
-
angle
CorrectIncorrect -
Question 823 of 1443
823. Question
3. Which function do you need to run an exponential smoothing model?
CorrectIncorrect -
Question 824 of 1443
824. Question
2. Why is it important to keep scale in mind when creating visualizations?
CorrectIncorrect -
Question 825 of 1443
825. Question
3. Which function denotes when you are looking for vertices?
CorrectIncorrect -
Question 826 of 1443
826. Question
3. Which function can you use to merge two files into one?
CorrectIncorrect -
Question 827 of 1443
827. Question
2. Which two packages do you need to load to parse email data?
Select all that applyCorrectIncorrect -
Question 828 of 1443
828. Question
4. Why does it make sense to separate the code in multiple steps?
Select all that applyCorrectIncorrect -
Question 829 of 1443
829. Question
5. Fill in the blank below.
-
In order to plot points of different sizes, you need to set the renderer argument to .
CorrectIncorrect -
-
Question 830 of 1443
830. Question
4. Why is the second line of code below (italicized for emphasis) important for the pull-down menu function?
selectInput('pTypeSubset', 'Provider Type Subset',c("All", sort(as.vector(unique(medicare$provider_type)))))CorrectIncorrect -
Question 831 of 1443
831. Question
5. What are some predictions that have been made based on social media, such as LinkedIn, blogs, Facebook, etc?
Select all that applyCorrectIncorrect -
Question 832 of 1443
832. Question
5. How might finding the purchase patterns of different groups help you with your customers?
Select all that applyCorrectIncorrect -
Question 833 of 1443
833. Question
3. You are testing a new classification algorithm. Which of the following results may suggest that your algorithm is performing accurately?
CorrectIncorrect -
Question 834 of 1443
834. Question
5. If most of the data points cluster around a regression line, it may be the case that:
CorrectIncorrect -
Question 835 of 1443
835. Question
5. Match the analytics methods to the companies.
Sort elements
- Kabbage
- Capital One
- President Obama's campaign
-
Uses a variety of data sources about the business and analyzes data from customer ratings and reviews to sales trends in real time to provide loans.
-
Used predictive analytics algorithms to provide customized credit offers to its customers.
-
Used an analytics team to build a predictive model that was deployed among millions of swing voters to persuade them to vote for the President.
CorrectIncorrect -
Question 836 of 1443
836. Question
3. Why is clustering more powerful than visualizing?
Select all that applyCorrectIncorrect -
Question 837 of 1443
837. Question
4. Sort the network from the broadest community to the most niche community.
-
Music lovers
-
Rock and Pop concert goers
-
Casual listeners of music and podcasts
-
Alternative and Top 40 bloggers and columnists
CorrectIncorrect -
-
Question 838 of 1443
838. Question
4. Which method can you use to find opinion leaders?
CorrectIncorrect -
Question 839 of 1443
839. Question
3. Which package is useful to parse text?
CorrectIncorrect -
Question 840 of 1443
840. Question
4. How do you measure the explanatory power of your predictive model?
CorrectIncorrect -
Question 841 of 1443
841. Question
4. Which statement below is TRUE?
CorrectIncorrect -
Question 842 of 1443
842. Question
3. Which notation below would correctly identify punctuation?
CorrectIncorrect -
Question 843 of 1443
843. Question
4. Which symbol below means "not" in R?
CorrectIncorrect -
Question 844 of 1443
844. Question
4. How can you remove individuals from your data that do not have connections?
CorrectIncorrect -
Question 845 of 1443
845. Question
4. Please fill in the blank below:
-
The () function finds the contents of a variable and the () function applies that first function to the list of variable names in a data set.
CorrectIncorrect -
-
Question 846 of 1443
846. Question
4. Big data is like
CorrectIncorrect -
Question 847 of 1443
847. Question
5. Which plot would best help us visualize nested data (lists within lists)?
CorrectIncorrect -
Question 848 of 1443
848. Question
5. Which industries can benefit from using predictive analytics?
Select all that applyCorrectIncorrect -
Question 849 of 1443
849. Question
5. What is something we CAN'T measure?
CorrectIncorrect -
Question 850 of 1443
850. Question
5. Which statement below is TRUE?
CorrectIncorrect -
Question 851 of 1443
851. Question
5. What are some use cases for the Jaccard Index?
Select all that applyCorrectIncorrect -
Question 852 of 1443
852. Question
4. Big data is like
CorrectIncorrect -
Question 853 of 1443
853. Question
Fill in the blank below.
-
Clustering assumes that is a measure for similarity. In other words, data points that are “closer” together physically in a graph are probably more similar than data points that are farther apart.
CorrectIncorrect -
-
Question 854 of 1443
854. Question
Which of the following are methods for importing data into SQL server?
CorrectIncorrect -
Question 855 of 1443
855. Question
How can you determine if the histogram of your residuals is really a normal, unbiased distribution?
CorrectIncorrect -
Question 856 of 1443
856. Question
What are the two ways you can use categorical variables in regression models?
Select all that applyCorrectIncorrect -
Question 857 of 1443
857. Question
Fill in the blank below.
-
A big strength of the package is the ability to customize graphs by adding layers and adjusting the data so it doesn't look generic. This is a package that brings a lot of flexibility in visualizing your data beyond bar charts.
CorrectIncorrect -
-
Question 858 of 1443
858. Question
Can a table in SQL be joined to itself? (True/False)
CorrectIncorrect -
Question 859 of 1443
859. Question
Which function runs thirty different tests and aggregates the results from each one?
CorrectIncorrect -
Question 860 of 1443
860. Question
How can you ensure that your analysis is reproducible?
CorrectIncorrect -
Question 861 of 1443
861. Question
What are some important questions you have to ask in order to be comfortable with your model?
Select all that applyCorrectIncorrect -
Question 862 of 1443
862. Question
How did GE use predictive analytics to offer tailored products to their customers?
CorrectIncorrect -
Question 863 of 1443
863. Question
Please fill in the blank below.
CorrectIncorrect -
Question 864 of 1443
864. Question
Please fill in the blank below:
-
A analysis quickly analyzes the outcome under a range of scenarios. It can be performed with one-way or two-way data tables.
CorrectIncorrect -
-
Question 865 of 1443
865. Question
Put the four steps of building a classification tree in order.
-
Create a new question branch after the previous one
-
Ask the question with the most amount of information
-
Stop growing the tree when there is no more information gain
-
Conditional on the previous answer, select the next question
CorrectIncorrect -
-
Question 866 of 1443
866. Question
Please fill in the blank below.
-
The two variables, and , are how the UI and server script communicate between each other. One of them is passed as the user puts in a command, and the other is passed back out with the results.
CorrectIncorrect -
-
Question 867 of 1443
867. Question
Please fill in the blank below.
-
Forecasting means to something after looking at the available information.
CorrectIncorrect -
-
Question 868 of 1443
868. Question
What are the three parameters that the Holt-Winters() function requires?
Please select all that applyCorrectIncorrect -
Question 869 of 1443
869. Question
Please put the general steps of principal component analysis in order.
-
Calculating eigenvalues and eigenvectors of the covariance matrix
-
Data preprocessing
-
Calculation of covariance matrix from the preprocessed data
-
Transform the samples onto new subspace
-
Choosing the components and forming a feature vector
CorrectIncorrect -
-
Question 870 of 1443
870. Question
3. Fill in the blank below.
-
Excel's visualization capabilities can be limited by its menus. R does not have such a constraint. As a result, you can create beautiful, varied visualizations and make more nuanced changes with R than with Excel.
CorrectIncorrect -
-
Question 871 of 1443
871. Question
4. Fill in the blank below.
-
It is best practice to annotate your code with , which you can do by putting a hashmark at the beginning of a line.
CorrectIncorrect -
-
Question 872 of 1443
872. Question
What happened when Telenor started contacting its customers?
CorrectIncorrect -
Question 873 of 1443
873. Question
Which function can you use to see the list of contents that your linear regression model produces?
CorrectIncorrect -
Question 874 of 1443
874. Question
What is one of the most effective methods for tuning an algorithm?
CorrectIncorrect -
Question 875 of 1443
875. Question
Why do we use ‘==‘ instead of ‘=‘ to pull the day shift data?
CorrectIncorrect -
Question 876 of 1443
876. Question
Which of these functions are the "bare bones" of ggplot2?
Select all that applyCorrectIncorrect -
Question 877 of 1443
877. Question
You can use the predict() function to make predictions using the model that you developed. Put the prediction use cases below in order according to the business function it was used for.
-
Sell: Harrah's Hotel and Casino in Las Vegas predicts how much a customer will spend over the years, estimating their lifetime value to the casino
-
Make: Life insurance companies predict the age of death in order to approve policies and set pricing
-
Ship: Energex (Australian utility) predicts 20 years of electricity demand growth to direct infrastructure investment
-
Buy: Ski manufacturers predict demand for skis each winter, stocking up on supplies
-
R&D: As much as 40% of trading on the London Stock Exchange is estimated to be driven by trading algorithms
CorrectIncorrect -
-
Question 878 of 1443
878. Question
What is supervised machine learning?
CorrectIncorrect -
Question 879 of 1443
879. Question
Which term represents the degree of slant in the data?
CorrectIncorrect -
Question 880 of 1443
880. Question
Why is it useful to audit your formulas?
CorrectIncorrect -
Question 881 of 1443
881. Question
Which attribute does not belong to clustering?
Select all that applyCorrectIncorrect -
Question 882 of 1443
882. Question
Which function results in an interactive slider?
CorrectIncorrect -
Question 883 of 1443
883. Question
What type of penalty shrinks coefficients towards zero to control variance?
CorrectIncorrect -
Question 884 of 1443
884. Question
Which text mining approach focuses on word counts without regarding the words' positions in sentences, part of speech, or meaning?
CorrectIncorrect -
Question 885 of 1443
885. Question
Which special operator does R have to calculate the dot product?
CorrectIncorrect -
Question 886 of 1443
886. Question
Which plot (pictured below) is an exploratory graph used for generalization of the simple two-variable scatterplot?
CorrectIncorrect -
Question 887 of 1443
887. Question
1. Fill in the missing word.
-
Algorithms and are data science tools. They go beyond running an analysis. When they are customized they take in your questions and data and yield specific, and often actionable, answers and outputs.
CorrectIncorrect -
-
Question 888 of 1443
888. Question
1. Fill in the blank below.
-
Forecasting means to something after looking at the available information.
CorrectIncorrect -
-
Question 889 of 1443
889. Question
1. Please fill in the blank below:
-
The centrality of a node is the percentage of shortest paths in a network that include a given node. This metric allows you to assess which nodes are prominent connectors in a network, indicating that this individual can be a vital connector, or this node can be a critical liability in a computer network or supply chain.
CorrectIncorrect -
-
Question 890 of 1443
890. Question
1. Why is it hard to visualize the baseball data with ggplot2?
Select all that applyCorrectIncorrect -
Question 891 of 1443
891. Question
1. Put the six Data Science control cycle steps in order, starting with “Ask”
-
Interpret
-
Research
-
Validate
-
Model
-
Test
-
Ask
CorrectIncorrect -
-
Question 892 of 1443
892. Question
1. Fill in the blank.
-
Some classification algorithms can go beyond determining whether someone will buy your product or not. The benefit of these algorithms is that they can tell you the that someone will buy your product.
CorrectIncorrect -
-
Question 893 of 1443
893. Question
1. What happened when Telenor started contacting its customers?
CorrectIncorrect -
Question 894 of 1443
894. Question
1. Match the description to the correct data set.
Sort elements
- Fits an initial model that can predict an outcome or category from one or more predictor variables
- Tunes the details of your model and checks the model assumptions
- Assesses the performance of an algorithm as if the data were from the real world
-
Training data set
-
Validation data set
-
Test data set
CorrectIncorrect -
Question 895 of 1443
895. Question
1. What are some of the practical applications of network analysis?
Select all that applyCorrectIncorrect -
Question 896 of 1443
896. Question
1. When is adjusted R squared significantly different from regular R squared?
CorrectIncorrect -
Question 897 of 1443
897. Question
1. What are the goals of this course?
Select all that applyCorrectIncorrect -
Question 898 of 1443
898. Question
1. Which functions do you need to use to plot a network where the nodes change color as they become affected or receive the message?
Select all that applyCorrectIncorrect -
Question 899 of 1443
899. Question
1. What is an issue that Google ran into with its search algorithm?
CorrectIncorrect -
Question 900 of 1443
900. Question
3. Fill in the blank below.
-
3. It's important to look at the raw data before you it so you can see what it looks like and find initial patterns and insights without doing too much analysis.
CorrectIncorrect -
-
Question 901 of 1443
901. Question
3. How does the 'expanded' layout change how the information is presented?
CorrectIncorrect -
Question 902 of 1443
902. Question
3. What happened when Telenor started contacting its customers?
CorrectIncorrect -
Question 903 of 1443
903. Question
2. Naïve Bayes is probabilistic classification method commonly used for text classification. Most spam filters are based on a variant of Naïve Bayes.
Order the steps that a spam filter takes when deciding whether or not a new email should be placed in the spam folder. Place the first step at the top.
-
Based on the results of the search, the probability of the email being spam is determined
-
The spam filter searches for keywords or word combinations that are frequently found in spam
-
The probability is evaluated against its threshold and decides whether to sort the email as spam or not
-
The text of the new is email is analyzed
CorrectIncorrect -
-
Question 904 of 1443
904. Question
2. Which of the following are questions that should be asked when building a model?
Select all that applyCorrectIncorrect -
Question 905 of 1443
905. Question
3. What is the Ark of the Covenant similar to in your data strategy?
CorrectIncorrect -
Question 906 of 1443
906. Question
3. What outcome can an association rule predict?
Select all that applyCorrectIncorrect -
Question 907 of 1443
907. Question
3. Fill in the blank.
-
At each step of the process important decisions need to be made, and you should be using to make the right choices.
CorrectIncorrect -
-
Question 908 of 1443
908. Question
2. What can regression do?
CorrectIncorrect -
Question 909 of 1443
909. Question
3. What is multicollinearity?
CorrectIncorrect -
Question 910 of 1443
910. Question
2. What is TRUE about finding alpha?
Select all that applyCorrectIncorrect -
Question 911 of 1443
911. Question
3. Match the function to the action it takes.
Sort elements
- creates the visualization
- further customizes the presentation of the network
- adds interactivity to the visualization
- defines the motion of the nodes and edges
-
visNetwork()
-
visOptions()
-
visInteraction()
-
visPhysics()
CorrectIncorrect -
Question 912 of 1443
912. Question
2. What does running a "while" loop do?
CorrectIncorrect -
Question 913 of 1443
913. Question
2. What does the gather function do?
Select all that applyCorrectIncorrect -
Question 914 of 1443
914. Question
3. What type of data does metadata contain?
Select all that applyCorrectIncorrect -
Question 915 of 1443
915. Question
3. Fill in the blank below.
-
You can create a by wrapping code in curly braces.
CorrectIncorrect -
-
Question 916 of 1443
916. Question
CorrectIncorrect -
Question 917 of 1443
917. Question
5. How does the regression feature help us understand this data set?
CorrectIncorrect -
Question 918 of 1443
918. Question
4. Why is it important to understand the purpose behind various data science methods?
CorrectIncorrect -
Question 919 of 1443
919. Question
4. Which function implements k-means clustering with cosine distance?
CorrectIncorrect -
Question 920 of 1443
920. Question
4. If your classification model has a perfect, 100% accuracy, which of the following questions should you ask?
CorrectIncorrect -
Question 921 of 1443
921. Question
4. If two factors are strongly correlated, such as "temperature" and "what the temperature feels like" in our Bikeshare example, then we are...
CorrectIncorrect -
Question 922 of 1443
922. Question
4. Which of these questions can you answer with data mining?
Select all that applyCorrectIncorrect -
Question 923 of 1443
923. Question
4. Which of these are examples of clustering?
Select all that applyCorrectIncorrect -
Question 924 of 1443
924. Question
5. Networks can contain a wealth of information. Which of the following questions are best be answered by measuring an aspect of the network (assuming the necessary data are available).
Select all that applyCorrectIncorrect -
Question 925 of 1443
925. Question
3. Which of these are types of classification?
Select all that applyCorrectIncorrect -
Question 926 of 1443
926. Question
4. Which function is the correct way to tell R to read the data as characters?
CorrectIncorrect -
Question 927 of 1443
927. Question
5. Match the terms to their definitions.
Sort elements
- Measure of how dispersed the data is
- Standardized measure of how dispersed the data is
- Check if there is bias in the data or the model
- Measure of linear relationship between variables (positive/negative)
- Measure of strength of linear relationship between variables (positive/negative)
- How a change in variable x will affect variable y
- % of variation in y that can be explained by the variation in x
- The probability that the pattern exists through random chance, in the absence of a relationship between variables
-
Variance
-
Standard deviation
-
Distribution and "normality"
-
Covariance
-
Correlation
-
Slope
-
R squared
-
p-values
CorrectIncorrect -
Question 928 of 1443
928. Question
4. Which visualizations below helped us to identify the periodicity of errors in our model?
Select all that applyCorrectIncorrect -
Question 929 of 1443
929. Question
4. Which function will make the data set horizontal?
CorrectIncorrect -
Question 930 of 1443
930. Question
4. What does the "select_nodes" function help you do?
Select all that applyCorrectIncorrect -
Question 931 of 1443
931. Question
4. Please fill in the blanks below:
-
is the most popular hierarchical clustering method, it’s a bottom-up approach, while does the opposite and is a top-down approach.
CorrectIncorrect -
-
Question 932 of 1443
932. Question
3. Which function will convert a website response to an R-readable format?
CorrectIncorrect -
Question 933 of 1443
933. Question
5. Match the job with the description.
Sort elements
- Asks questions about the data to find patterns and interpret results
- Builds models to answer questions and understand the data source
- Organizes the data and creates some basic visualizations to give an overview of the data
- Manipulates the data into proper format
-
Data scientist
-
Data modeler
-
Data analyst
-
Data wrangler
CorrectIncorrect -
Question 934 of 1443
934. Question
5. What are some of the advantages of interactive visualizations?
Select all that applyCorrectIncorrect -
Question 935 of 1443
935. Question
5. Which one of these is not a way for Kabbage to gather information on lending decisions?
Select all that applyCorrectIncorrect -
Question 936 of 1443
936. Question
5. Which function can you use to eliminate specific pieces of data?
CorrectIncorrect -
Question 937 of 1443
937. Question
5. Which function can you use to create a forecast using the LOESS model?
CorrectIncorrect -
Question 938 of 1443
938. Question
5. Which function allows you to combine two separate data sets?
CorrectIncorrect -
Question 939 of 1443
939. Question
5. Match the job with the description.
Sort elements
- Asks questions about the data to find patterns and interpret results
- Builds models to answer questions and understand the data source
- Organizes the data and creates some basic visualizations to give an overview of the data
- Manipulates the data into proper format
-
Data scientist
-
Data modeler
-
Data analyst
-
Data wrangler
CorrectIncorrect -
Question 940 of 1443
940. Question
How does clustering help when there are more than 3 attributes in the data?
CorrectIncorrect -
Question 941 of 1443
941. Question
Which of the following SQL functions can be used on date fields?
Select all that applyCorrectIncorrect -
Question 942 of 1443
942. Question
Sort elements
- includes the values of the boxplot levels. The five rows include the bottom whisker, the 25th percentile, the 50th percentile, the 75th percentile and the top whisker
- includes the number of values in each variable
- includes something called notches or the median plus and minus roughly one point five times the inter-quartile range
- includes the values of the outliers, which you can also see in the boxplot
-
$stats
-
$n
-
$conf
-
$out
CorrectIncorrect -
Question 943 of 1443
943. Question
Which approach allows for the inclusion of categorical variables with multiple levels in regression models?
CorrectIncorrect -
Question 944 of 1443
944. Question
Fill in the blank below.
-
The function shows us the structure of the data.
CorrectIncorrect -
-
Question 945 of 1443
945. Question
Which of the following SQL functions can be used on text fields?
Select all that applyCorrectIncorrect -
Question 946 of 1443
946. Question
Fill in the blank below.
-
Clustering and data mining are types of data analysis , which is a type of data analysis where the intent is to see what the data can tell us beyond modeling or hypothesis testing.
CorrectIncorrect -
-
Question 947 of 1443
947. Question
What are some conclusions we see when we graph points per game by minutes per game with three clusters?
Select all that applyCorrectIncorrect -
Question 948 of 1443
948. Question
After running a Breusch-Pagan test, how would you know that there is no heteroscedasticity?
Select all that applyCorrectIncorrect -
Question 949 of 1443
949. Question
The example below is an example of which aspect of the 3 V's?
"1 flight of a Boeing 737 across the continental United States generates as much data as is stored in the U.S. Library of Congress."
CorrectIncorrect -
Question 950 of 1443
950. Question
After running a Breusch-Pagan test, how would I know that there is no heteroscedasticity?
Select all that applyCorrectIncorrect -
Question 951 of 1443
951. Question
What are some of the benefits of Scenario Manager?
Select all that applyCorrectIncorrect -
Question 952 of 1443
952. Question
Match the attributes to the decision tree calculation.
Sort elements
- Entropy
- Gini impurity
-
Categorical attributes
Finds the largest class in the data
Uses algorithms
-
Continuous variables
Finds groups of classes that make up over 50% of their data
Minimizes classification
CorrectIncorrect -
Question 953 of 1443
953. Question
Put the steps in order for how the UI script communicates with the server script.
-
The UI passes information to the server
-
The server computes some new output
-
The UI displays the information for the user
-
The user interacts with the UI
-
The server sends the output to the UI
CorrectIncorrect -
-
Question 954 of 1443
954. Question
What can regression do?
CorrectIncorrect -
Question 955 of 1443
955. Question
Match the terms to their definitions.
Sort elements
- Measure of how dispersed the data is
- Standardized measure of how dispersed the data is
- Check if there is bias in the data or the model
- Measure of linear relationship between variables (positive/negative)
- Measure of strength of linear relationship between variables (positive/negative)
- How a change in variable x will affect variable y
- % of variation in y that can be explained by the variation in x
- The probability that the pattern exists through random chance, in the absence of a relationship between variables
-
Variance
-
Standard deviation
-
Distribution and "normality"
-
Covariance
-
Correlation
-
Slope
-
R squared
-
p-values
CorrectIncorrect -
Question 956 of 1443
956. Question
Match the types of trust to their definitions.
Sort elements
- Rational decision about whether to trust someone based on the potential costs and benefits of the decisions involved
- Trust developed over a long relationship
- Trust based on likeness in preferences, opinions
- Trust based on the guarantees promised by an institutions, such as defined benefit pension plans or a government's promise to protect its people
-
Calculation-based trust
-
Personal-based trust
-
Similarity-based trust
-
Institution-based trust
CorrectIncorrect -
Question 957 of 1443
957. Question
4. Fill in the blank below.
-
It is best practice to annotate your code with , which you can do by putting a hashmark at the beginning of a line.
CorrectIncorrect -
-
Question 958 of 1443
958. Question
5. Why will the following code give you an error?
a <- "Hello"
A
CorrectIncorrect -
Question 959 of 1443
959. Question
Which of these are examples of clustering?
Select all that applyCorrectIncorrect -
Question 960 of 1443
960. Question
Which picture below displays the standard error of a best fit line?
CorrectIncorrect -
Question 961 of 1443
961. Question
What is the complexity parameter?
CorrectIncorrect -
Question 962 of 1443
962. Question
Why does it make sense to separate the code in multiple steps?
Select all that applyCorrectIncorrect -
Question 963 of 1443
963. Question
Which function adds up the data in the previous cells to create a new column or row with cumulative sums?
CorrectIncorrect -
Question 964 of 1443
964. Question
Which questions can datafication help us answer
Select all that applyCorrectIncorrect -
Question 965 of 1443
965. Question
What is unsupervised machine learning?
CorrectIncorrect -
Question 966 of 1443
966. Question
Which function measures the kurtosis of your data?
CorrectIncorrect -
Question 967 of 1443
967. Question
Which error appears for an invalid cell reference?
CorrectIncorrect -
Question 968 of 1443
968. Question
What is the complexity parameter?
CorrectIncorrect -
Question 969 of 1443
969. Question
Which part of the "SimpleApp" application is the user input?
CorrectIncorrect -
Question 970 of 1443
970. Question
Why is bagging useful when you are working with a small dataset?
CorrectIncorrect -
Question 971 of 1443
971. Question
What does the syntax below mean in R?
"[^A-z]"CorrectIncorrect -
Question 972 of 1443
972. Question
Which R package contains the SVM model functions?
CorrectIncorrect -
Question 973 of 1443
973. Question
What is an example of how the direction of trust does not always go both ways?
CorrectIncorrect -
Question 974 of 1443
974. Question
1. Internal data may be some of a company's most valuable data. Which of the following may be valuable sources of internal data?
Select all that applyCorrectIncorrect -
Question 975 of 1443
975. Question
1. Which function can you use to see the list of contents that your linear regression model produces?
CorrectIncorrect -
Question 976 of 1443
976. Question
1. Please fill in the blank below:
-
communication played a key role in the infamous bankruptcy of energy trader ENRON.
CorrectIncorrect -
-
Question 977 of 1443
977. Question
1. Which of the answers below passes the output of one function into the input of another function?
CorrectIncorrect -
Question 978 of 1443
978. Question
2. How does clustering help when there are more than 3 attributes in the data?
CorrectIncorrect -
Question 979 of 1443
979. Question
1. With network analysis, which of the following is the least common metric to be determined?
CorrectIncorrect -
Question 980 of 1443
980. Question
2. How did GE use predictive analytics to offer tailored products to their customers?
CorrectIncorrect -
Question 981 of 1443
981. Question
2. Fill in the blank below.
-
Each represents an individual or an object in the network. Each represents a relationship between two people, places or objects.
CorrectIncorrect -
-
Question 982 of 1443
982. Question
2. Match the function to its purpose.
Sort elements
- setting your working directory
- load your data
- load the ggmap package
- see how many calls you have remaining
-
setwd()
-
read.csv()
-
install.packages("ggmap")
-
geocodeQueryCheck()
CorrectIncorrect -
Question 983 of 1443
983. Question
1. Which questions can datafication help us answer?
Select all that applyCorrectIncorrect -
Question 984 of 1443
984. Question
1. What is TRUE about API?
Select all that applyCorrectIncorrect -
Question 985 of 1443
985. Question
1. Put the steps in order for creating a function that will render an animation for the dispersion simulation.
-
Close the while() loop
-
Update the variable from step 2 to tell R that we’re on the next step of the simulation
-
For each step in the simulation update the color of the points
-
Plot the 3rd graph
-
Plot the 2nd graph
-
Set the layout of the image defining how the 3 or more graphs should be laid out
-
Plot the 1st graph
-
Run a while() loop that runs starting with the number of the variable in step 2 and until every node in your graph is reached
-
Set a new variable that denotes the step of the simulation equal to 1
-
Use the saveHTML function in the animation package
-
Set the file name, image size and other output options
CorrectIncorrect -
-
Question 986 of 1443
986. Question
1. What does it mean when R says a graph is acyclic?
CorrectIncorrect -
Question 987 of 1443
987. Question
2. Fill in the blanks below.
-
data displays multiple occurrences per row and is easier to read in tables, while data displays one observation per row and is easier to plot with in ggplot2.
CorrectIncorrect -
-
Question 988 of 1443
988. Question
2. Put the steps for creating a Shiny application in order
-
Build the ui.R script
-
Build the server.R script
-
Save the ui.R script in the folder
-
Save the server.R script in the folder
-
Run the application
-
Create a new folder with the name of the application
CorrectIncorrect -
-
Question 989 of 1443
989. Question
2. Which of the following statements is not true about k-means clustering?
CorrectIncorrect -
Question 990 of 1443
990. Question
2. Match the network to the possible connections.
Sort elements
- followers
- friends
- co-stars
- alma mater
- emails
- what grocery store you go to
-
Twitter
-
Facebook
-
Netflix catalog
-
Past presidents
-
Your company
-
City
CorrectIncorrect -
Question 991 of 1443
991. Question
2. Please fill in the blank below:
-
The opposite of big data is .
CorrectIncorrect -
-
Question 992 of 1443
992. Question
2. Which of the following statements is not true about k-means clustering?
CorrectIncorrect -
Question 993 of 1443
993. Question
3. Based on this word cloud, generated from hotel reviews, order the words by frequency. Put the most frequently used words at the top.
-
Staff
-
Golf
-
Beach
-
Room
CorrectIncorrect -
-
Question 994 of 1443
994. Question
2. Networks can be comprised of
Select all that applyCorrectIncorrect -
Question 995 of 1443
995. Question
2. Match the variables in the equation "y = mx + b" to what they represent in the equation.
Sort elements
- The output variable, or the dependent variable
- The independent variable, or the variable you plug in to determine the output
- The y-intercept, or the value of y when x = 0
- The rate of change, or the slope
-
y
-
x
-
b
-
m
CorrectIncorrect -
Question 996 of 1443
996. Question
2. Fill in the blank below.
-
You can create a plot to check if the residuals in your model are normally distributed.
CorrectIncorrect -
-
Question 997 of 1443
997. Question
2. Which function allows you to create a forecast for your model?
CorrectIncorrect -
Question 998 of 1443
998. Question
3. What does it mean when someone communicates a lot or has a lot of followers but has no incoming messages and follows few others?
CorrectIncorrect -
Question 999 of 1443
999. Question
3. Match the functions to their actions.
Sort elements
- Reads each line as a separate character
- Split the characters based on the condition in the quotes
- Creates a data frame that shows the number of nodes that received the message
- Plots a graph with given data
-
readLines()
-
strsplit()
-
sapply()
-
plot()
CorrectIncorrect -
Question 1000 of 1443
1000. Question
2. What can identification of communities help uncover?
Select all that applyCorrectIncorrect -
Question 1001 of 1443
1001. Question
3. What's the appropriate syntax for calling up sequential file names in a loop?
CorrectIncorrect -
Question 1002 of 1443
1002. Question
4. Why is it useful to create functions?
Select all that applyCorrectIncorrect -
Question 1003 of 1443
1003. Question
4. Fill in the blank below.
-
As it turns out, a map of DC looks somewhat similar to the crime map of DC.
CorrectIncorrect -
-
Question 1004 of 1443
1004. Question
3. Which two functions can pass rCharts objects to Shiny?
Select all that applyCorrectIncorrect -
Question 1005 of 1443
1005. Question
4. Fill in the blanks below.
-
The method discovers new groups or categories of data, while the method assigns data points to known groups or categories.
CorrectIncorrect -
-
Question 1006 of 1443
1006. Question
3. Why wouldn't a silhouette value be computed with one cluster?
CorrectIncorrect -
Question 1007 of 1443
1007. Question
5. Increasing the number of variables in a predictive model may not be beneficial because...
CorrectIncorrect -
Question 1008 of 1443
1008. Question
4. Match the situation with your next step.
Sort elements
- Next, you should run a regression analysis.
- Next, you should run a multivariate regression analysis.
- Next, you should run a polynomial regression analysis.
- Next, you should run a LOWESS or LOESS regression analysis.
-
You want to see how two variables interact.
-
You want to see how five variables interact.
-
You want to see if you can get a better fit with your five variables.
-
You want to see if your five variables are being influenced by seasonal changes.
CorrectIncorrect -
Question 1009 of 1443
1009. Question
4. Why did the Literary Digest incorrectly forecast a presidential win?
CorrectIncorrect -
Question 1010 of 1443
1010. Question
5. How might finding the purchase patterns of different groups help you with your customers?
Select all that applyCorrectIncorrect -
Question 1011 of 1443
1011. Question
4. How can you use association rules in different industries?
Sort elements
- Organize store layout, create catalogs, design discount patterns
- Track behavior of users, Improve ad positioning, detect intrusions
- Find functional/structural patterns for a set of proteins
- Find words that your customers use frequently to evaluate marketing campaigns, feature improvement
-
Retail
-
Site developers
-
Bioinformatics
-
Social Media marketing
CorrectIncorrect -
Question 1012 of 1443
1012. Question
4. The process of extracting information from large quantities of data to find insights, patterns and other latent information is referred to as
CorrectIncorrect -
Question 1013 of 1443
1013. Question
5. Match the functions to their purpose.
Sort elements
- to see how many calls you have remaining
- to see the warnings
- to combine two columns of your data set
- to rename columns
- to save your file so that you don't have to re-run the code again
-
geocodeQueryCheck()
-
warnings ()
-
cbind()
-
as.data.frame()
-
write.csv()
CorrectIncorrect -
Question 1014 of 1443
1014. Question
4. What do you need to run an F-test?
Select all that applyCorrectIncorrect -
Question 1015 of 1443
1015. Question
3. Which visualization below is showing the periodicity of the data?
CorrectIncorrect -
Question 1016 of 1443
1016. Question
4. Which package allows you save your output as an html file?
CorrectIncorrect -
Question 1017 of 1443
1017. Question
4. Which function allows you to create a data frame?
CorrectIncorrect -
Question 1018 of 1443
1018. Question
5. Hierarchical clustering assumes that points with the shortest distance between them are:
CorrectIncorrect -
Question 1019 of 1443
1019. Question
4. What does it mean if someone on Twitter has a high in-degree and low out-degree?
Select all that applyCorrectIncorrect -
Question 1020 of 1443
1020. Question
2. Data scientists’ responsibilities may include:
Select all that applyCorrectIncorrect -
Question 1021 of 1443
1021. Question
5. Which of these features are available in RStudio? (Go into Global Options)
Select all that applyCorrectIncorrect -
Question 1022 of 1443
1022. Question
5. Which of these are examples of dark data?
Select all that applyCorrectIncorrect -
Question 1023 of 1443
1023. Question
5. Why is calculating closeness centrality useful?
Select all that applyCorrectIncorrect -
Question 1024 of 1443
1024. Question
5. What can you do if you have missing data?
Select all that applyCorrectIncorrect -
Question 1025 of 1443
1025. Question
5. Which package has the "ddply" function?
CorrectIncorrect -
Question 1026 of 1443
1026. Question
Put the six Data Science control cycle steps in order, starting with “Ask”
-
Validate
-
Model
-
Ask
-
Research
-
Interpret
-
Test
CorrectIncorrect -
-
Question 1027 of 1443
1027. Question
Match the terms to the descriptions.
Sort elements
- Betweenss
- Withinss
- Totss
-
Sum of all the squared distances between data points in different clusters
-
Sum of all the squared distances between points within the same cluster
-
Total sum of squares
CorrectIncorrect -
Question 1028 of 1443
1028. Question
Which of the following SQL functions can be used on date fields?
Select all that applyCorrectIncorrect -
Question 1029 of 1443
1029. Question
5. What are two ways you can have increased certainty in your model's accuracy?
Select all that applyCorrectIncorrect -
Question 1030 of 1443
1030. Question
Sort the variables as either continuous or discrete.
Sort elements
- Number of cars, number of buildings, temperature
- Days of the week, months of the year
- Colors, types of weather, names
-
Continuous variables
-
Discrete variables
-
Discrete variables without a defined sequence
CorrectIncorrect -
Question 1031 of 1443
1031. Question
Fill in the blank below.
-
In graphics, the transparency argument is called , where 0 is entirely transparent, and the default of 1 is entirely opaque.
CorrectIncorrect -
-
Question 1032 of 1443
1032. Question
Order these logical operators from fastest to slowest in terms of query performance:
-
LIKE
-
<>
-
=
-
>,>=,<,<=
CorrectIncorrect -
-
Question 1033 of 1443
1033. Question
Fill in the blanks below.
-
The method is part of unsupervised machine learning and discovers new patterns or groups of data, while the method is part of supervised machine learning and assigns data points to known groups or categories.
CorrectIncorrect -
-
Question 1034 of 1443
1034. Question
How does industry knowledge help us understand our analysis?
CorrectIncorrect -
Question 1035 of 1443
1035. Question
Match the methods of variable selection to the correct descriptions.
Sort elements
- Algorithm starts with a model of 0 variables and continues to add more variables based upon a specified measure
- Starts with a model of all variables, and removes variables based upon a specified measure
- Combination of forward and backward selection that starts with a model of 0 variables and adds variables, but can also remove variables based upon a specified measure
-
Forward selection
-
Backward selection
-
Step-wise selection
CorrectIncorrect -
Question 1036 of 1443
1036. Question
The 3 V's of data are:
Select all that applyCorrectIncorrect -
Question 1037 of 1443
1037. Question
How do you measure the explanatory power of your predictive model?
CorrectIncorrect -
Question 1038 of 1443
1038. Question
What are the three parts of an optimization model?
CorrectIncorrect -
Question 1039 of 1443
1039. Question
Put the four steps of building a classification tree in order.
-
Conditional on the previous answer, select the next question
-
Stop growing the tree when there is no more information gain
-
Ask the question with the most amount of information
-
Create a new question branch after the previous one
CorrectIncorrect -
-
Question 1040 of 1443
1040. Question
What are two ways to run a Shiny application?
Select all that applyCorrectIncorrect -
Question 1041 of 1443
1041. Question
Using the Capital Bikeshare data, what questions can we answer through regression analysis?
Select all that applyCorrectIncorrect -
Question 1042 of 1443
1042. Question
-
If you add the row and the row, then you get the observed data row.
CorrectIncorrect -
-
Question 1043 of 1443
1043. Question
Please fill in the blank below.
-
The Index is a way of measuring the extent of similarity between two people or objects.
CorrectIncorrect -
-
Question 1044 of 1443
1044. Question
5. Why will the following code give you an error?
a <- "Hello"
A
CorrectIncorrect -
Question 1045 of 1443
1045. Question
1. Why is it useful to use the script window for writing code?
Select all that applyCorrectIncorrect -
Question 1046 of 1443
1046. Question
Which of the following statements is not true about k-means clustering?
Select all that applyCorrectIncorrect -
Question 1047 of 1443
1047. Question
What is TRUE about correlation?
Select all that applyCorrectIncorrect -
Question 1048 of 1443
1048. Question
Which of these is not an attribute of classification?
Select all that applyCorrectIncorrect -
Question 1049 of 1443
1049. Question
Which of the answers below is a function?
Select all that applyCorrectIncorrect -
Question 1050 of 1443
1050. Question
Which function converts wide data to long data?
CorrectIncorrect -
Question 1051 of 1443
1051. Question
What is a good way to test for multicollinearity?
CorrectIncorrect -
Question 1052 of 1443
1052. Question
Which of these are examples of dark data?
Select all that applyCorrectIncorrect -
Question 1053 of 1443
1053. Question
What does covariance measure?
Select all that applyCorrectIncorrect -
Question 1054 of 1443
1054. Question
What tab can you find the charting functionality in?
CorrectIncorrect -
Question 1055 of 1443
1055. Question
Which of these is not an attribute of classification?
Select all that applyCorrectIncorrect -
Question 1056 of 1443
1056. Question
Why can't we calculate the denominator of the Naive Bayes formula?
CorrectIncorrect -
Question 1057 of 1443
1057. Question
Which statement is NOT true about random forest?
CorrectIncorrect -
Question 1058 of 1443
1058. Question
Why is it important to convert all words to lower case before removing 'stop words'?
CorrectIncorrect -
Question 1059 of 1443
1059. Question
What should you do to a non-linearly separable data set?
CorrectIncorrect -
Question 1060 of 1443
1060. Question
What is TRUE about the Jaccard Index?
CorrectIncorrect -
Question 1061 of 1443
1061. Question
1. Fill in the blank below.
-
William Deming who is known for training hundreds of engineers, managers, and scholars about statistical process control in Japan after World War 2 has a saying “In God we trust. All others must bring .”
CorrectIncorrect -
-
Question 1062 of 1443
1062. Question
1. Fill in the blank below.
-
measures how changes in one variable effects another variable.
CorrectIncorrect -
-
Question 1063 of 1443
1063. Question
1. How do you automate the process for reading and formatting multiple files?
CorrectIncorrect -
Question 1064 of 1443
1064. Question
1. Why is it useful to use the script window for writing code?
Select all that applyCorrectIncorrect -
Question 1065 of 1443
1065. Question
1. What is the main problem of visualizing the ebola data set in ggplot?
CorrectIncorrect -
Question 1066 of 1443
1066. Question
1. Fill in the blank below.
-
The main goal of clustering is to intra-cluster distance (the distance between points in a cluster) and inter-cluster distance (the distance between clusters).
CorrectIncorrect -
-
Question 1067 of 1443
1067. Question
2. Fill in the blank.
-
You can use to help answer questions, such as "Who do your customers trust?" and "How does information spread within your company?"
CorrectIncorrect -
-
Question 1068 of 1443
1068. Question
1. Match the reason data are valuable with its description.
Sort elements
- Maintaining accurate and secure data for a long period of time may help prove accountability and avoid penalties.
- Through the use of data, processes that were previously manual may be made more efficient.
- Descriptive statistics can reveal what has already happened and may provide surface-level insights.
- The use of data science methods can help extract novel, powerful insights, anticipate behaviors, and build tools.
-
Compliance
-
Automation
-
Dashboards
-
Predictive analytics
CorrectIncorrect -
Question 1069 of 1443
1069. Question
1. Which of these relationship types could be in a network?
Select all that applyCorrectIncorrect -
Question 1070 of 1443
1070. Question
1. Why is it important to think about the purpose of the analysis before you manipulate your data?
Select all that applyCorrectIncorrect -
Question 1071 of 1443
1071. Question
1. Fill in the blanks below.
-
You always have to your models and check for potential even before you can test it on new data!
CorrectIncorrect -
-
Question 1072 of 1443
1072. Question
1. What is the "for" loop used for in R?
CorrectIncorrect -
Question 1073 of 1443
1073. Question
1. What problems will you solve in this course?
Select all that applyCorrectIncorrect -
Question 1074 of 1443
1074. Question
2. How can you search for multiple terms in one row?
CorrectIncorrect -
Question 1075 of 1443
1075. Question
2. Fill in the blank below.
-
The str() function shows us the of the data.
CorrectIncorrect -
-
Question 1076 of 1443
1076. Question
3. Which analogy best describes the UI and server script?
CorrectIncorrect -
Question 1077 of 1443
1077. Question
2. Match the ggplot function to its purpose.
Sort elements
- geom_point
- ggtitle
- xlab
- ylab
- scale_shape_manual
-
Specifies to map the data as points.
-
Specifies the title of the graph.
-
Labels the x axis.
-
Labels the y axis.
-
Specifies how the legend and data points should be displayed.
CorrectIncorrect -
Question 1078 of 1443
1078. Question
3. Put the events in order to describe how an economic network may expand. Place the first event on top.
-
The factory requires the presence of construction crews and equipment
-
New factories and stores are built to meet an increase in demand
-
The families of the construction crews spend money in the city
-
A company decides to build new a factory in town
CorrectIncorrect -
-
Question 1079 of 1443
1079. Question
3. When you have data,
CorrectIncorrect -
Question 1080 of 1443
1080. Question
2. Why are the coordinates of the cheese data set centroids in decimals?
CorrectIncorrect -
Question 1081 of 1443
1081. Question
2. Fill in the blank below.
-
The fallacy involves making a decision based solely on easy quantitative observations and ignoring all other latent observations.
CorrectIncorrect -
-
Question 1082 of 1443
1082. Question
3. Select the statement below that is TRUE.
CorrectIncorrect -
Question 1083 of 1443
1083. Question
3. What is the first thing you need to do when you begin working in R?
CorrectIncorrect -
Question 1084 of 1443
1084. Question
3. Fill in the blank below.
-
coding is an approach that allows for the inclusion of categorical variables with multiple levels in regression models.
CorrectIncorrect -
-
Question 1085 of 1443
1085. Question
3. What do you need to do after every forecast period?
Select all that applyCorrectIncorrect -
Question 1086 of 1443
1086. Question
2. Fill in the blank below.
-
You can use the function from the "data.table" package to make sure the columns have the same name so we can join the two data sets.
CorrectIncorrect -
-
Question 1087 of 1443
1087. Question
2. Which code below correctly shows how to take all the points that are reached by the 20th iteration of the simulation and make them blue?
CorrectIncorrect -
Question 1088 of 1443
1088. Question
3. Match the definition of the type of linkage with the correct term.
Sort elements
- Minimum distance between points
- Maximum distance between points
- Group distance average
- Distance between centroids
-
Single linkage
-
Complete linkage
-
Average linkage
-
Centroid linkage
CorrectIncorrect -
Question 1089 of 1443
1089. Question
2. What are some properties of data in JSON format?
Select all that applyCorrectIncorrect -
Question 1090 of 1443
1090. Question
5. Good coding habits include:
Select all that applyCorrectIncorrect -
Question 1091 of 1443
1091. Question
5. Fill in the blank below.
-
The package makes it easier to work with dates in R
CorrectIncorrect -
-
Question 1092 of 1443
1092. Question
4. Why is it useful to host apps on external sites?
Select all that applyCorrectIncorrect -
Question 1093 of 1443
1093. Question
3. Why do we cluster only Democrat-introduced bills instead of both Democrat- and Republican-introduced bills?
CorrectIncorrect -
Question 1094 of 1443
1094. Question
4. Why do we look at 4 and 9 clusters when they only have an explained variance of 13.4%?
CorrectIncorrect -
Question 1095 of 1443
1095. Question
4. Match the common relationships or patterns with the type of network they represent.
Sort elements
- Organizational relationships
- Communication patterns
- Economic, environmental, or geographic relationships
- Connections based on interests, preferences, or similarities
-
Parent and child
-
Emails between co-workers
-
Citizens in the same tax bracket or state
-
Members of the same gym
CorrectIncorrect -
Question 1096 of 1443
1096. Question
4. Which of the following are common causes of outliers?
CorrectIncorrect -
Question 1097 of 1443
1097. Question
5. Fill in the blank below:
-
Remember, like all resources, - data that cannot fit on a single computer or server - has to be cost effective.
CorrectIncorrect -
-
Question 1098 of 1443
1098. Question
4. Fill in the blank below.
-
You need to understand how much your algorithm can explain the results in your data and how much of it is that is always present in large data sets and cannot be accounted for by your model.
CorrectIncorrect -
-
Question 1099 of 1443
1099. Question
5. A company is planning to re-brand one of its products and the product director wants to know how customers feel about some potential product names. Text mining can be most beneficial in which of these situations?
CorrectIncorrect -
Question 1100 of 1443
1100. Question
5. Besides network analysis, what are some other ways to approach data mining?
Select all that applyCorrectIncorrect -
Question 1101 of 1443
1101. Question
3. Fill in the blank below.
-
You can automate a customized analysis by creating a !
CorrectIncorrect -
-
Question 1102 of 1443
1102. Question
3. Which function should you use to save your ggpairs analysis in R?
CorrectIncorrect -
Question 1103 of 1443
1103. Question
5. Exponential smoothing assumes data is made up of which 2 components?
Select all that applyCorrectIncorrect -
Question 1104 of 1443
1104. Question
4. What are some examples of the functionality can have in your interactive visualization?
Select all that applyCorrectIncorrect -
Question 1105 of 1443
1105. Question
3. Which function do you need to use to finish the saving process?
CorrectIncorrect -
Question 1106 of 1443
1106. Question
3. Why do you need to include two data sets in the graph.data.frame() function?
CorrectIncorrect -
Question 1107 of 1443
1107. Question
5. Match the method with the description.
Sort elements
- Closeness centrality
- Betweenness centrality
- Eigenvector centrality
- PageRank score
- Jaccard Index
- Hierarchical clustering
-
Measures how quickly someone can spread a message that reaches every other point in the network
-
Measures how significant a node is as a connector of the ecosystem.
-
Measures who important someone is something is based on what they’re connected to.
-
Measures how important someone is based on their relative role in the network.
-
Measures how similar or redundant 2 elements of a network are and helps detect fraud
-
Takes the Jaccard Index to the next level of application and identifies communities by measuring the similarities of nodes.
CorrectIncorrect -
Question 1108 of 1443
1108. Question
2. R can read all these different file types except
CorrectIncorrect -
Question 1109 of 1443
1109. Question
5. Which method helps you model and understand how a disease spreads?
CorrectIncorrect -
Question 1110 of 1443
1110. Question
5. Which of the examples below demonstrates the "Shipping" step of business functions?
Select all that applyCorrectIncorrect -
Question 1111 of 1443
1111. Question
5. Which symbol below do you use to end the for( ) loop?
CorrectIncorrect -
Question 1112 of 1443
1112. Question
5. Why is it important to make sure your data looks clean?
CorrectIncorrect -
Question 1113 of 1443
1113. Question
5. Why do you use the "set seed" function?
Select all that applyCorrectIncorrect -
Question 1114 of 1443
1114. Question
2. R can read all these different file types except
CorrectIncorrect -
Question 1115 of 1443
1115. Question
In order for us to determine how much variation our clusters account for, we need to:
CorrectIncorrect -
Question 1116 of 1443
1116. Question
Put the following SQL clauses in the correct standard query template order:
-
GROUP BY
-
HAVING
-
SELECT
-
INTO
-
ORDER BY
-
WHERE
-
FROM
CorrectIncorrect -
-
Question 1117 of 1443
1117. Question
In a non-biased model errors will be random. If errors are not random it means...
Select all that applyCorrectIncorrect -
Question 1118 of 1443
1118. Question
How do we know we still need to refine our model further?
CorrectIncorrect -
Question 1119 of 1443
1119. Question
Fill in the blanks below.
CorrectIncorrect -
Question 1120 of 1443
1120. Question
Match the following SQL Server components to their definition
Sort elements
- programs that provides database services to other computer programs
- a container of data/information organized into tables (and other structures) so that they can be easily managed and accessed back in same fashion.
- data stored in a tabular format with rows of named columns
- An application used to configure, manage, and administer components of SQL server (i.e. the user interface for accessing servers, databases, and tables to launch commands to the server)
-
Server
-
Database
-
Table
-
SQL Server Management Studio
CorrectIncorrect -
Question 1121 of 1443
1121. Question
Fill in the blank below.
-
The main goal of clustering is to intra-cluster distance (the distance between points in a cluster) and inter-cluster distance (the distance between clusters). This ensures that the clusters are as defined and separated as possible.
CorrectIncorrect -
-
Question 1122 of 1443
1122. Question
How can you determine if the histogram of your residuals is really a normal, unbiased distribution?
CorrectIncorrect -
Question 1123 of 1443
1123. Question
What are some key things you should always check for in your model?
Select all that applyCorrectIncorrect -
Question 1124 of 1443
1124. Question
What are some advantages of Excel?
Select all that applyCorrectIncorrect -
Question 1125 of 1443
1125. Question
How do you calculate R squared?
CorrectIncorrect -
Question 1126 of 1443
1126. Question
Match the algorithm to the situation below:
Sort elements
- Generalized Reduced Gradient (GRG) Nonlinear
- Simplex LP
- Evolutionary
-
A problem that is smooth and nonlinear
-
A problem that is linear
-
A problem that is non-smooth
CorrectIncorrect -
Question 1127 of 1443
1127. Question
Match the attributes to the decision tree calculation.
Sort elements
- Entropy
- Gini impurity
-
Categorical attributes
Finds the largest class in the data
Uses algorithms
-
Continuous variables
Finds groups of classes that make up over 50% of their data
Minimizes classification
CorrectIncorrect -
Question 1128 of 1443
1128. Question
Match the R script to its corresponding description.
Sort elements
- global.R
- server.R
- ui.R
-
Contains all the data and packages needed to run the application
-
Contains the computational logic needed to display results that depend on user input
-
Contains graphical user interface i.e what the app looks like and the control that user interacts with
CorrectIncorrect -
Question 1129 of 1443
1129. Question
Put the steps in order for regression using random forest:
-
Each tree is grown as long as possible without pruning
-
Random p predictors are selected for splitting the node of trees
-
Random forest selects n observations randomly with replacement (bootstrapping)
-
New data is predicted by taking average of the predictions of all n trees
CorrectIncorrect -
-
Question 1130 of 1443
1130. Question
Match the kernel type to the description below.
Sort elements
- Linear
- Polynomial
- RBF (radial basis)
- Sigmoid
-
Tells the SVM function that the data can be separated by a straight line
-
A function in the form of a polynomial
-
A function that maps / projects data that is non-linearly separable
-
A function that maps / projects non-linearly separable data, but doesn't exist under certain circumstances
CorrectIncorrect -
Question 1131 of 1443
1131. Question
Please fill in the blank below.
-
The Index will calculate the similarity between politicians # and their donors by comparing the people that they are connected to.
CorrectIncorrect -
-
Question 1132 of 1443
1132. Question
1. Why did we choose R programming language over other languages?
Select all that applyCorrectIncorrect -
Question 1133 of 1443
1133. Question
Why do we use packages for data manipulation instead of just using built-in R functions?
Select all that applyCorrectIncorrect -
Question 1134 of 1443
1134. Question
Which function makes sure that the k-means analysis is reproducible?
CorrectIncorrect -
Question 1135 of 1443
1135. Question
What is R Squared?
CorrectIncorrect -
Question 1136 of 1443
1136. Question
Which attribute does not belong to clustering?
Select all that applyCorrectIncorrect -
Question 1137 of 1443
1137. Question
Fill in the blank below.
-
You can create a by wrapping code in curly braces. This can help you streamline your code to perform multiple steps in one line, similar to a for() loop.
CorrectIncorrect -
-
Question 1138 of 1443
1138. Question
Why does R put an 'X' in front of numerical column names?
Select all that applyCorrectIncorrect -
Question 1139 of 1443
1139. Question
Which package do we use to run the vif() function?
CorrectIncorrect -
Question 1140 of 1443
1140. Question
- When you’re removing duplicates, what should you do to ensure that you do not permanently lose the data?
CorrectIncorrect -
Question 1141 of 1443
1141. Question
Why should you be careful when using summary statistics?
CorrectIncorrect -
Question 1142 of 1443
1142. Question
What keys should you press to freeze panes?
CorrectIncorrect -
Question 1143 of 1443
1143. Question
Which of the following is a practical challenge that companies face when using data?
CorrectIncorrect -
Question 1144 of 1443
1144. Question
Which of these is NOT an idea behind the Naive Bayes classifier?
CorrectIncorrect -
Question 1145 of 1443
1145. Question
What is true of the boosting approach?
Please select all that applyCorrectIncorrect -
Question 1146 of 1443
1146. Question
What is a Term Document Matrix?
CorrectIncorrect -
Question 1147 of 1443
1147. Question
What is the implication of overfitting?
Please select all that applyCorrectIncorrect -
Question 1148 of 1443
1148. Question
Which statement below is TRUE?
CorrectIncorrect -
Question 1149 of 1443
1149. Question
1. Fill in the blank below.
-
Clustering assumes that is a measure for similarity. In other words, data points that are “closer” together are probably more similar than data points that are farther apart.
CorrectIncorrect -
-
Question 1150 of 1443
1150. Question
1. How do you calculate R squared?
CorrectIncorrect -
Question 1151 of 1443
1151. Question
1. What would be the output of the following code for vector 'v':
v[2:7]
CorrectIncorrect -
Question 1152 of 1443
1152. Question
2. Match each plot to the layout
Sort elements
- Stacked
- Expanded
- Streamed
CorrectIncorrect -
Question 1153 of 1443
1153. Question
1. What is an important step so that R can read numbers as categories?
CorrectIncorrect -
Question 1154 of 1443
1154. Question
1. The strength of a relationship or ties can vary. Match the description to either weak or strong ties.
Sort elements
- Strong ties
- Weak ties
- Weak ties
- Strong ties
-
People we really trust and rely on
-
Help a company learn and expand its reach
-
People we're connected to with different perspectives
-
Help a company through difficult times and gain a reputation
CorrectIncorrect -
Question 1155 of 1443
1155. Question
2. Fill in the blank below:
-
Data is not a burdensome workload; rather, it is a that companies can tap to discover new insights and drive their business forward.
CorrectIncorrect -
-
Question 1156 of 1443
1156. Question
1. With network analysis, which of the following is the least common metric to be determined?
CorrectIncorrect -
Question 1157 of 1443
1157. Question
1. Match the measures to their descriptions.
Sort elements
- Measures the number of edges that each node has. Useful if you are thinking about who to target first in a marketing campaign.
- Measures the average of the shortest path lengths from the node to every other node in the network. Useful to understand a viral marketing campaign or when selecting the best shipping routes.
- Measures the percentage of shortest paths in a network that include a given node. Useful to assess the extent to which someone is a prominent connector in a network.
-
Degree centrality
-
Closeness centrality
-
Betweenness centrality
CorrectIncorrect -
Question 1158 of 1443
1158. Question
2. Fill in the blank below.
-
A good explanatory model will have residuals whose variance does not depend on the (predictor) variables.
CorrectIncorrect -
-
Question 1159 of 1443
1159. Question
1. Match the functions to the actions they perform in R.
Sort elements
- applies a function to a list and outputs a list.
- searches for an object and returns its contents.
- executes a function onto a list of arguments.
- saves your work so you don't lose the data!
-
lapply()
-
get()
-
do.call()
-
write.csv()
CorrectIncorrect -
Question 1160 of 1443
1160. Question
1. Match the types of trust to their definitions.
Sort elements
- Rational decision about whether to trust someone based on the potential costs and benefits of the decisions involved
- Trust developed over a long relationship
- Trust based on likeness in preferences, opinions
- Trust based on the guarantees promised by an institutions, such as defined benefit pension plans or a government's promise to protect its people
-
Calculation-based trust
-
Personal-based trust
-
Similarity-based trust
-
Institution-based trust
CorrectIncorrect -
Question 1161 of 1443
1161. Question
1. Please fill in the blank below:
-
An address has 4 numbers between 0 and 255 separate by periods that is assigned to an individual accessing a website. The site can often identify which specific computer is being used.
CorrectIncorrect -
-
Question 1162 of 1443
1162. Question
2. Which piece of code will change the heatmap colors so they have a low of green and a high of red?
CorrectIncorrect -
Question 1163 of 1443
1163. Question
2. Put the steps in order for how the UI script communicates with the server script
-
The server computes some new output
-
The UI passes information to the server
-
The UI displays the information for the user
-
The user interacts with the UI
-
The server sends the output to the UI
CorrectIncorrect -
-
Question 1164 of 1443
1164. Question
2. Which function runs thirty different tests and aggregates the results from each one?
CorrectIncorrect -
Question 1165 of 1443
1165. Question
3. Match each person in the network with their strength.
Sort elements
- Greatest ability to spread a message
- Can reach the most people in the shortest amount of time
- Is a great connector
-
A person with a lot of connections
-
A person whose average path to all others is shortest
-
A person with the most shortest paths
CorrectIncorrect -
Question 1166 of 1443
1166. Question
2. Match the function to the question.
Sort elements
- How do you optimize the design of your products?
- Where can your organization get the resources it needs to create its good or service?
- How can you ensure the quality of the product and forecast demand?
- How can you improve routes and identify the most efficient yet low cost strategy for the number of delivery vehicles and staff?
- Which people are you targeting with your advertising?
-
Research and Development
-
Procurement
-
Production
-
Shipment
-
Sales
CorrectIncorrect -
Question 1167 of 1443
1167. Question
3. What are some limitations of the k-means analysis on cheese customers?
Select all that applyCorrectIncorrect -
Question 1168 of 1443
1168. Question
2. What can we assume when there were no more spikes in tweets of sympathy after the Newtown shooting occurred?
CorrectIncorrect -
Question 1169 of 1443
1169. Question
2. Using the the for loop function, or for(), is useful because
Select all that applyCorrectIncorrect -
Question 1170 of 1443
1170. Question
2. Fill in the blank below.
-
is on average, how widely actual data is dispersed around (the predicted values, the mean, etc.).
CorrectIncorrect -
-
Question 1171 of 1443
1171. Question
2. What are the two ways you can use categorical variables in regression models?
Select all that applyCorrectIncorrect -
Question 1172 of 1443
1172. Question
3. What is TRUE about measuring for seasonality?
Select all that applyCorrectIncorrect -
Question 1173 of 1443
1173. Question
3. Match the measures of centrality to the correct description.
Sort elements
- % of shortest paths in a network that include a given node
- a count of the number of ties directed to the node
- the number of ties that the node directs to others
-
Betweenness Centrality
-
In-degree Centrality
-
Out-degree Centrality
CorrectIncorrect -
Question 1174 of 1443
1174. Question
2. Fill in the blanks below.
-
par() stands for and mar() stands for .
CorrectIncorrect -
-
Question 1175 of 1443
1175. Question
2. Which function creates a vector of sequential colors in a hexadecimal format?
CorrectIncorrect -
Question 1176 of 1443
1176. Question
2. Fill in the blank below.
-
To make sure your images are reproducible, you can use the function.
CorrectIncorrect -
-
Question 1177 of 1443
1177. Question
4. Fill in the blank below.
-
While it may look like a scatter plot, a maps a third variable to the size of its points.
CorrectIncorrect -
-
Question 1178 of 1443
1178. Question
3. Fill in the blank below
-
You can create a by wrapping code in curly braces.
CorrectIncorrect -
-
Question 1179 of 1443
1179. Question
3. Why is SelectorGadget useful for web scraping?
CorrectIncorrect -
Question 1180 of 1443
1180. Question
5. Match the terms to the descriptions.
Sort elements
- Betweenss
- Withinss
- Totss
-
Sum of all the squared distances between data points in different clusters
-
Sum of all the squared distances between points within the same cluster
-
Total sum of squares
CorrectIncorrect -
Question 1181 of 1443
1181. Question
5. It's very important that you don't mistake randomness for...
CorrectIncorrect -
Question 1182 of 1443
1182. Question
5. Using this network visualization, order the relationships based upon the strength of their connection. Put the strongest connection on top.
-
The relationship between C and D
-
The relationship between C and B
-
The relationship between A and B
-
The relationship between A and C
CorrectIncorrect -
-
Question 1183 of 1443
1183. Question
4. Which statement about APIs is true?
CorrectIncorrect -
Question 1184 of 1443
1184. Question
3. Which of the following are epistemological challenges?
Select all that applyCorrectIncorrect -
Question 1185 of 1443
1185. Question
5. How else can you apply clustering?
Select all that applyCorrectIncorrect -
Question 1186 of 1443
1186. Question
4. Your target demographic is educated, single women who are 25-40 years old. If you use text mining to analyze their comments on your website, what might you find?
Select all that applyCorrectIncorrect -
Question 1187 of 1443
1187. Question
4. Match the questions with the correct step in the Data Science Control Cycle.
Sort elements
- What is the problem we need to solve?
- What data do you need for your analysis and how can you get it?
- Which method(s) is appropriate to use?
- Do the model and assumptions work as expected?
- How does the model generalize to real world data?
- How can we use the conclusions in the real world?
-
Step 1: Ask
-
Step 2: Research
-
Step 3: Model
-
Step 4: Validate
-
Step 5: Test
-
Step 6: Interpret
CorrectIncorrect -
Question 1188 of 1443
1188. Question
4. Which code below shows the correct way of using a function you have created?
Select all that applyCorrectIncorrect -
Question 1189 of 1443
1189. Question
4. Match the function to the visualization it helps to create.
Sort elements
- ggpairs()
- ggplot()
- corrplot()
- boxplot()
- cooks.distance()
CorrectIncorrect -
Question 1190 of 1443
1190. Question
CorrectIncorrect -
Question 1191 of 1443
1191. Question
4. Match the network analysis application to the correct part of the data control cycle.
Sort elements
- What does an economic system rely on?
- How do you optimize your supplier network?
- Determine concentration of risk in the production process.
- Optimize distribution of goods in your warehouses.
- Who has a reliable customer base? How can you extend it?
-
R&D
-
Buy
-
Make
-
Ship
-
Sell
CorrectIncorrect -
Question 1192 of 1443
1192. Question
4. Match the parts of the code below to their purposes.
matrix(c(1, 1, 2, 2,
1, 1, 3, 3),
nrow = 2,
ncol = 4,
byrow = TRUE)
Sort elements
- creates a matrix from the given set of values
- encloses the values of the matrix
- sets the number of rows
- sets the number of the columns
- tells R to order the data by rows instead of by columns
-
m()
-
c()
-
nrow =
-
ncol =
-
byrow =
CorrectIncorrect -
Question 1193 of 1443
1193. Question
4. What negative effect does the image below illustrate?
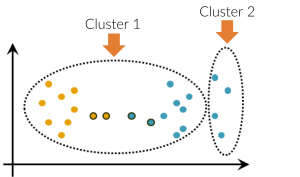 CorrectIncorrect
 -
Question 1194 of 1443
1194. Question
CorrectIncorrect -
Question 1195 of 1443
1195. Question
1. Put the six data science control cycle steps in order, starting with “Ask”.
-
Validate
-
Ask
-
Test
-
Interpret
-
Research
-
Model
CorrectIncorrect -
-
Question 1196 of 1443
1196. Question
5. Which of these are examples of clustering?
Select all that applyCorrectIncorrect -
Question 1197 of 1443
1197. Question
5. Why would you use a confusion matrix?
CorrectIncorrect -
Question 1198 of 1443
1198. Question
5. What is the first relationship we are going to look at using the Capital Bikeshare data?
CorrectIncorrect -
Question 1199 of 1443
1199. Question
5. Which function helps you to remove duplicate data from your data set?
CorrectIncorrect -
Question 1200 of 1443
1200. Question
5. Why is it helpful to sort the data in decreasing order by the weighted Jaccard similarity?
Select all that applyCorrectIncorrect -
Question 1201 of 1443
1201. Question
2. What are two ways to import data from your computer into RStudio?
Select all that applyCorrectIncorrect -
Question 1202 of 1443
1202. Question
What are some conclusions from the visualization of Congress?
Select all that applyCorrectIncorrect -
Question 1203 of 1443
1203. Question
What are the three types of relationships between tables?
Select all that applyCorrectIncorrect -
Question 1204 of 1443
1204. Question
Fill in the blank below.
-
To speed up our work and avoid running calculations on each data point manually, we can use the loop function, which performs a set of operations as many times as you tell it to. The advantage to this loop is that you can run different types of data through the same operations, and it does it automatically.
CorrectIncorrect -
-
Question 1205 of 1443
1205. Question
What are some things you should always check for in your model?
Select all that applyCorrectIncorrect -
Question 1206 of 1443
1206. Question
Which of these is not a common data problem?
CorrectIncorrect -
Question 1207 of 1443
1207. Question
Match the table combination types with their definitions:
Sort elements
- brings columns from 2 different tables into a combined table
- appends records from 2 tables into a combined table
-
JOIN
-
UNION
CorrectIncorrect -
Question 1208 of 1443
1208. Question
Fill in the blank below.
CorrectIncorrect -
Question 1209 of 1443
1209. Question
Sort elements
- includes the values of the boxplot levels. The five rows include the bottom whisker, the 25th percentile, the 50th percentile, the 75th percentile and the top whisker
- includes the number of values in each variable
- includes something called notches or the median plus and minus roughly one point five times the inter-quartile range
- includes the values of the outliers, which you can also see in the boxplot
-
$stats
-
$n
-
$conf
-
$out
CorrectIncorrect -
Question 1210 of 1443
1210. Question
What are the two ways you can use categorical variables in regression models?
Select all that applyCorrectIncorrect -
Question 1211 of 1443
1211. Question
Match the Excel features to their function
Sort elements
- Columns
- Rows
- Name Box
- Formula Bar
- Worksheet / tab
-
Alphabetically labeled vertical cells
-
Numerically labeled horizontal cells
-
Tells you what cell you are in
-
Shows you the formula for the highlighted cell
-
A sheet with individual rows and columns
CorrectIncorrect -
Question 1212 of 1443
1212. Question
What did the polling practices of the 1936 U.S. election illustrate?
Select all that applyCorrectIncorrect -
Question 1213 of 1443
1213. Question
Match the method to the description (note: there are more methods listed than necessary).
Sort elements
- Clustering
- Network analysis
- Text mining
- Forecasting
- Regression
-
Measures similarity between data points to group them and identify key similarities that you can use to find trends
-
Looks at how people, places, and other entities are connected, which can help you determine a sphere of influence and how to propagate your message quickly and effectively
-
Digests large amounts of text quickly and finds common themes, messages and patterns.
CorrectIncorrect -
Question 1214 of 1443
1214. Question
Order these data formats from most to least structured.
-
Data with identifiable patterns in its presentation, but is without clear labels and organization
-
Data without a pre-defined format, such as sound or video data
-
Data with labels and organization, but is not in a table
-
Data presented in a table
CorrectIncorrect -
-
Question 1215 of 1443
1215. Question
What are some advantages of using Shiny?
Please select all that applyCorrectIncorrect -
Question 1216 of 1443
1216. Question
What are some ways that you can fix multicollinearity?
Please select all that applyCorrectIncorrect -
Question 1217 of 1443
1217. Question
What are some of the pros of SVM?
CorrectIncorrect -
Question 1218 of 1443
1218. Question
How do you down-weight famous people and boost less famous ones?
CorrectIncorrect -
Question 1219 of 1443
1219. Question
3. What is supervised machine learning?
CorrectIncorrect -
Question 1220 of 1443
1220. Question
What type of data does the grep() function work with?
CorrectIncorrect -
Question 1221 of 1443
1221. Question
What is an important step so that R can read numbers as categories?
CorrectIncorrect -
Question 1222 of 1443
1222. Question
What do you need to run an F-test?
Select all that applyCorrectIncorrect -
Question 1223 of 1443
1223. Question
Which of these is not a strength of kNN?
Select all that applyCorrectIncorrect -
Question 1224 of 1443
1224. Question
Why do we need to validate the model?
CorrectIncorrect -
Question 1225 of 1443
1225. Question
Why do we use packages for data manipulation instead of just using built-in R functions?
Select all that applyCorrectIncorrect -
Question 1226 of 1443
1226. Question
CorrectIncorrect -
Question 1227 of 1443
1227. Question
What keys should you press to freeze panes?
CorrectIncorrect -
Question 1228 of 1443
1228. Question
What is the objective of a good model?
CorrectIncorrect -
Question 1229 of 1443
1229. Question
Why do you need to change the NA values to '#N/A'?
CorrectIncorrect -
Question 1230 of 1443
1230. Question
Which programming languages can not be used for data analysis?
CorrectIncorrect -
Question 1231 of 1443
1231. Question
CorrectIncorrect -
Question 1232 of 1443
1232. Question
What does it mean if an observation has more weight in a decision tree?
CorrectIncorrect -
Question 1233 of 1443
1233. Question
When would bike demand be the greatest in Washington DC?
CorrectIncorrect -
Question 1234 of 1443
1234. Question
Why did NAs appear when we initially read in the data?
CorrectIncorrect -
Question 1235 of 1443
1235. Question
What is TRUE if more people know each other in a community?
Select all that applyCorrectIncorrect -
Question 1236 of 1443
1236. Question
1. Google's API (application program interface) allows users to:
CorrectIncorrect -
Question 1237 of 1443
1237. Question
1. How can you apply k-Nearest Neighbors for general functions of an organization?
Sort elements
- Classify products among competing companies
- Evaluate which parts are likely to fail based on usage history of similar parts
- Evaluate job applicants in a quantitative way to eliminate bias
- Quantitatively determine which customers are most similar and should be either approached in the same way or avoided entirely
-
Research and development
-
Procurement
-
Production and manufacturing
-
Sales and marketing
CorrectIncorrect -
Question 1238 of 1443
1238. Question
1. Fill in the blank below.
-
A regression model with several variables is called regression.
CorrectIncorrect -
-
Question 1239 of 1443
1239. Question
1. Which operator pulls rows that contain specified terms you're searching for to create a new dataset with only those rows?
CorrectIncorrect -
Question 1240 of 1443
1240. Question
1. Fill in the blanks below
-
Shiny applications have two basic components - the script and the script.
CorrectIncorrect -
-
Question 1241 of 1443
1241. Question
1. Fill in the blank below.
-
The method plots the percentage of variance explained by clustering for different numbers of clusters, which allows us to see how the variance differs with the number of clusters that you choose.
CorrectIncorrect -
-
Question 1242 of 1443
1242. Question
1. Which of the following sources would need to be datafied or converted into numbers, so that you can run analyses and gain greater insight?
CorrectIncorrect -
Question 1243 of 1443
1243. Question
1. Fill in the blank below.
-
While Big Data is a resource, is the domain that will draw insights from the data.
CorrectIncorrect -
-
Question 1244 of 1443
1244. Question
2. Fill in the blank below.
-
You can use to help answer questions, such as "Who do your customers trust?" and "How does information spread within your company?"
CorrectIncorrect -
-
Question 1245 of 1443
1245. Question
1. Fill in the blank below.
-
You have to use the function for randomized algorithms to ensure consistency of outputs.
CorrectIncorrect -
-
Question 1246 of 1443
1246. Question
1. What are some important questions you have to ask in order to be comfortable with your model?
Select all that applyCorrectIncorrect -
Question 1247 of 1443
1247. Question
1. Which package has the "join" command that allows you to combine datasets?
CorrectIncorrect -
Question 1248 of 1443
1248. Question
1. Match the two sections of Congress to their correct descriptions.
Sort elements
- Made up of 435 elected representatives that are proportional to the population of each state. Each representative serves a 2 year term, no limits on re-election.
- Made up of 100 elected senators per state. Each senator serves a 6 year term, no limits on re-election.
-
House of Representatives
-
Senate
CorrectIncorrect -
Question 1249 of 1443
1249. Question
10. After a needlestick injury, how soon should you have your blood drawn?
CorrectIncorrect -
Question 1250 of 1443
1250. Question
3. How can you display the plot once it's assigned to a variable?
Select all that applyCorrectIncorrect -
Question 1251 of 1443
1251. Question
3. What are two ways to run a Shiny application?
Select all that applyCorrectIncorrect -
Question 1252 of 1443
1252. Question
3. What is one of the dangers of increasing the number of clusters?
CorrectIncorrect -
Question 1253 of 1443
1253. Question
2. There is a new employee starting at the firm. Using the graph of current employees, which employee do you predict the new employee will have the strongest ties with?
The new employee (CTO) majored in Literature and previously worked at Microsoft. They have one child and vacation every year in Jamaica. They will be located at the San Fransisco office.
CorrectIncorrect -
Question 1254 of 1443
1254. Question
3. Data science will allow you to:
Select all that applyCorrectIncorrect -
Question 1255 of 1443
1255. Question
3. Match each question with the best method for answering it.
Sort elements
- Clustering
- Classification
- Clustering
- Classification
- Clustering
- Classification
-
Based on their shopping history, what commonalities are there among our customers?
-
Based on a customer's shopping patterns, is it likely that this customer is pregnant?
-
What do people think about our brand?
-
Is it likely that this shopper will purchase our product?
-
When a disease spreads, are there any patterns in its spreading?
-
With the symptoms exhibited, what diagnosis might a doctor propose?
CorrectIncorrect -
Question 1256 of 1443
1256. Question
3. Why might Item Response Theory have trouble analyzing sentiment from tweets?
Select all that applyCorrectIncorrect -
Question 1257 of 1443
1257. Question
2. Which package can we use to plot a network graph and measure centrality?
CorrectIncorrect -
Question 1258 of 1443
1258. Question
3. In a non-biased model errors will be random. If errors are not random it means...
Select all that applyCorrectIncorrect -
Question 1259 of 1443
1259. Question
3. What is a good way to test for multicollinearity?
CorrectIncorrect -
Question 1260 of 1443
1260. Question
3. What is TRUE about LOESS?
Select all that applyCorrectIncorrect -
Question 1261 of 1443
1261. Question
2. What does directed betweenness help you understand?
CorrectIncorrect -
Question 1262 of 1443
1262. Question
2. Match the networks to their network analysis use cases.
Sort elements
- How can I reach the greatest number of people at the lowest cost?
- How does a disease spread across a population?
- Are money flows suspicious?
- How to identify key influencers in a network to affect voters and donors?
-
Marketing
-
Healthcare
-
Finance
-
Politics
CorrectIncorrect -
Question 1263 of 1443
1263. Question
3. What is the name of the chart below?
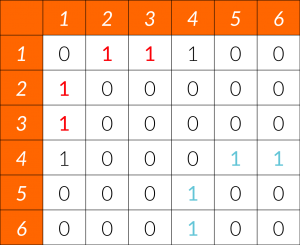 CorrectIncorrect
 -
Question 1264 of 1443
1264. Question
2. What do you insert the needle through when drawing up medication?
CorrectIncorrect -
Question 1265 of 1443
1265. Question
5. The aes layer contains:
CorrectIncorrect -
Question 1266 of 1443
1266. Question
4. Why is it useful to create functions?
Select all that applyCorrectIncorrect -
Question 1267 of 1443
1267. Question
4. Match the HTML tags to their description (note: there are more answer choices than necessary)
Sort elements
- paragraph
- hyperlink
- table
- line break
- tab
-
<p>
-
<a>
-
<tb>
CorrectIncorrect -
Question 1268 of 1443
1268. Question
4. Which function makes sure that the k-means analysis is reproducible?
CorrectIncorrect -
Question 1269 of 1443
1269. Question
4. What happened when Telenor started contacting its customers?
CorrectIncorrect -
Question 1270 of 1443
1270. Question
4. Which of the following is MOST characteristic of an opinion leader?
CorrectIncorrect -
Question 1271 of 1443
1271. Question
5. Twitter is an example of a company that has an API. Which of the following data could you access via its API?
Select all that applyCorrectIncorrect -
Question 1272 of 1443
1272. Question
5. Fill in the blank.
-
To avoid falsely concluding that one event caused another, a possible method to use is testing.
CorrectIncorrect -
-
Question 1273 of 1443
1273. Question
5. Increasing the number of variables in a predictive model may not be beneficial because...
CorrectIncorrect -
Question 1274 of 1443
1274. Question
5. Fill in the blank below.
-
is the conversion of seemingly immeasurable information into something that we can measure.
CorrectIncorrect -
-
Question 1275 of 1443
1275. Question
3. Which theory posits that people are more interconnected than we may realize?
CorrectIncorrect -
Question 1276 of 1443
1276. Question
4. What are some use case questions that can be answered by analyzing networks?
Select all that applyCorrectIncorrect -
Question 1277 of 1443
1277. Question
4. Which function below allows you to add a best-fit plane to your 3D plot?
CorrectIncorrect -
Question 1278 of 1443
1278. Question
4. What is the seasonality factor?
CorrectIncorrect -
Question 1279 of 1443
1279. Question
5. How can you avoid variance in the Twitter user data?
Select all that applyCorrectIncorrect -
Question 1280 of 1443
1280. Question
5. Fill in the blanks below.
-
The argument defines the size of the axis markers and the argument determines the size of the axis labels.
CorrectIncorrect -
-
Question 1281 of 1443
1281. Question
5. Match the graphs to the modularity scores.
Sort elements
- Modularity of 0.9
- Modularity of 0.7
- Modularity of 0.55
- Modularity of 0.15
CorrectIncorrect -
Question 1282 of 1443
1282. Question
5. Which package should you install to plot an interactive network visualization?
CorrectIncorrect -
Question 1283 of 1443
1283. Question
5. Which function adds up the data in the previous cells to create a new column or row with cumulative sums?
CorrectIncorrect -
Question 1284 of 1443
1284. Question
5. What types of data are difficult to cluster?
Select all that applyCorrectIncorrect -
Question 1285 of 1443
1285. Question
5. Which of these situations below can you apply Naïve Bayes to?
Select all that applyCorrectIncorrect -
Question 1286 of 1443
1286. Question
5. What are two ways you can have increased certainty in your model's accuracy?
Select all that applyCorrectIncorrect -
Question 1287 of 1443
1287. Question
5. Why is creating a visNetwork useful?
Select all that applyCorrectIncorrect -
Question 1288 of 1443
1288. Question
5. Which of these are limitations of clustering that you should consider as the data set increases in size?
Select all that applyCorrectIncorrect -
Question 1289 of 1443
1289. Question
3. What are two ways to load data from the Internet into RStudio?
Select all that applyCorrectIncorrect -
Question 1290 of 1443
1290. Question
Which function runs thirty different tests and aggregates the results from each one?
CorrectIncorrect -
Question 1291 of 1443
1291. Question
Sort elements
- DROP
- INSERT
- UPDATE
- CASE
- DELETE
- CAST or CONVERT
-
Remove the entire table
-
Add a row for company ABC for 2005 to the table
-
Change the value 1,500 to 15,000
-
Return a conditional value (e.g. large company or small company) based on the number of employees
-
Remove the row with company ABC
-
Specify that a query return the employees field as an integer
CorrectIncorrect -
Question 1292 of 1443
1292. Question
Match the functions to the actions they perform in R.
Sort elements
- produces the variance of a data set
- creates a data frame
- view the output
- calculates the standard deviation
-
var()
-
data.frame()
-
View()
-
sd()
CorrectIncorrect -
Question 1293 of 1443
1293. Question
Match the key terms below to their descriptions.
Sort elements
- Check if there is bias in the data or the model
- The probability that the pattern exists through random chance
- Test for multicollinearity and independent variable interaction
- Check the residuals for heteroscedasticity (pattern contingent on fitted values)
- Check for information loss when selecting the right model for your data
-
Q-Q plot/ distribution of errors
-
p-values
-
VIF
-
Breusch-Pagan test
-
AIC
CorrectIncorrect -
Question 1294 of 1443
1294. Question
Which of the following are methods for importing data into SQL server?
CorrectIncorrect -
Question 1295 of 1443
1295. Question
Match the function to its purpose.
Sort elements
- searches for text in data
- gives you the length of any vector
- tabulates the number of entries for categorical data
- sorts data by a particular column
-
grep()
-
length()
-
table()
-
order()
CorrectIncorrect -
Question 1296 of 1443
1296. Question
The aes layer contains:
CorrectIncorrect -
Question 1297 of 1443
1297. Question
5. What are two ways you can have increased certainty in your model's accuracy?
Select all that applyCorrectIncorrect -
Question 1298 of 1443
1298. Question
Which approach allows for the inclusion of categorical variables with multiple levels in regression models?
CorrectIncorrect -
Question 1299 of 1443
1299. Question
Please fill in the blank below.
-
In order to freeze a reference, you can use the .
CorrectIncorrect -
-
Question 1300 of 1443
1300. Question
Match the terms to their definitions.
Sort elements
- Measure of how dispersed the data is
- Standardized measure of how dispersed the data is
- Measure of linear relationship between variables (positive/negative)
- Measure of strength of linear relationship between variables (positive/negative)
- How a change in variable x will affect variable y
- The probability that the pattern exists through random chance, in the absence of a relationship between variables
-
Variance
-
Standard deviation
-
Covariance
-
Correlation
-
Slope
-
p-values
CorrectIncorrect -
Question 1301 of 1443
1301. Question
Fill in the blank below.
-
Clustering assumes that is a measure for similarity. In other words, data points that are “closer” together physically in a graph are probably more similar than data points that are farther apart.
CorrectIncorrect -
-
Question 1302 of 1443
1302. Question
When using data you may encounter any of the challenges listed below. Match each challenge with its description.
Sort elements
- Having the right staff with the right skills
- Getting the right data, the right sample size, and statistical significance
- Using data that may not have been collected with your intended use in mind
- Putting all the pieces together to extract meaningful insights from your data and use them in a responsible way
-
Practical challenge
-
Epistemological challenge
-
Ethical challenge
-
Grand challenge
CorrectIncorrect -
Question 1303 of 1443
1303. Question
How do you stop the Shiny application from running?
CorrectIncorrect -
Question 1304 of 1443
1304. Question
What are some ways to standardize different scales?
CorrectIncorrect -
Question 1305 of 1443
1305. Question
In the SVM sample, why do we only compare the x coordinates of each data point against the lines?
CorrectIncorrect -
Question 1306 of 1443
1306. Question
What can identification of communities help uncover?
Select all that applyCorrectIncorrect -
Question 1307 of 1443
1307. Question
2. Why do we need to validate the model?
CorrectIncorrect -
Question 1308 of 1443
1308. Question
Which function eliminates duplicate rows?
CorrectIncorrect -
Question 1309 of 1443
1309. Question
Why is clustering more powerful than visualizing?
Select all that applyCorrectIncorrect -
Question 1310 of 1443
1310. Question
What does it mean if you have a small p-value?
CorrectIncorrect -
Question 1311 of 1443
1311. Question
Which of these functions are the "bare bones" of ggplot2?
Select all that applyCorrectIncorrect -
Question 1312 of 1443
1312. Question
What is supervised machine learning?
CorrectIncorrect -
Question 1313 of 1443
1313. Question
What does it mean when there is a high positive correlation between two attributes?
CorrectIncorrect -
Question 1314 of 1443
1314. Question
When running a variable selection model, how does the computer know when it has found the right variables?
CorrectIncorrect -
Question 1315 of 1443
1315. Question
Why do you need to change the NA values to '#N/A'?
CorrectIncorrect -
Question 1316 of 1443
1316. Question
Fill in the blank below.
CorrectIncorrect -
Question 1317 of 1443
1317. Question
Which of these data types can you select in the 'validation criteria'?
Please select all that applyCorrectIncorrect -
Question 1318 of 1443
1318. Question
What questions should you ask about your data?
Select all that applyCorrectIncorrect -
Question 1319 of 1443
1319. Question
What happens when the ROC curve is closer to a right angle?
CorrectIncorrect -
Question 1320 of 1443
1320. Question
Which feature was the most important feature identified by the boosted tree algorithm?
CorrectIncorrect -
Question 1321 of 1443
1321. Question
Which of these questions may be most impacted by seasons or cycles?
Select all that applyCorrectIncorrect -
Question 1322 of 1443
1322. Question
Which function implements k-means clustering with cosine distance?
CorrectIncorrect -
Question 1323 of 1443
1323. Question
What type of clean text data do you need for annotation and parts of speech tagging?
CorrectIncorrect -
Question 1324 of 1443
1324. Question
1. Conditional statements are useful when:
CorrectIncorrect -
Question 1325 of 1443
1325. Question
1. If an algorithm has 25% probability of correct classification and then is increased to 50%, what is the percent increase in accuracy?
CorrectIncorrect -
Question 1326 of 1443
1326. Question
1. Fill in the blank below.
-
seasonality is a seasonal pattern that is repeated plus a certain value.
CorrectIncorrect -
-
Question 1327 of 1443
1327. Question
1. Fill in the blank below.
-
The 'gg' in ggplot2 stands for .
CorrectIncorrect -
-
Question 1328 of 1443
1328. Question
1. Fill in the blank below
-
The two variables, and , are how the UI and server script communicate between each other.
CorrectIncorrect -
-
Question 1329 of 1443
1329. Question
2. Fill in the blank below.
-
is a measure of the extent to which an increase in one variable corresponds to the increase in another variable.
CorrectIncorrect -
-
Question 1330 of 1443
1330. Question
2. Fill in the blank.
-
Through the Security and Exchange Commission was able to identify what Enron leadership was communicating about via email.
CorrectIncorrect -
-
Question 1331 of 1443
1331. Question
1. Order these data formats from most to least structured.
-
Data without a pre-defined format, such as sound or video data
-
Data with labels and organization, but is not in a table
-
Data presented in a table
-
Data with identifiable patterns in its presentation, but is without clear labels and organization
CorrectIncorrect -
-
Question 1332 of 1443
1332. Question
1. The strength of a relationship or ties can vary. Match the description to either weak or strong ties.
Sort elements
- Strong ties
- Weak ties
- Weak ties
- Strong ties
-
People we really trust and rely on
-
Help a company learn and expand its reach
-
People we're connected to with different perspectives
-
Help a company through difficult times and gain a reputation
CorrectIncorrect -
Question 1333 of 1443
1333. Question
1. Fill in the blank below.
-
The number of shortest paths going through a given node is called centrality.
CorrectIncorrect -
-
Question 1334 of 1443
1334. Question
1. When running a variable selection model, how does the computer know when it has found the right variables?
CorrectIncorrect -
Question 1335 of 1443
1335. Question
2. In a communication network, what does it mean when someone "listens" or "follows" others but has no followers or outgoing communication?
CorrectIncorrect -
Question 1336 of 1443
1336. Question
1. Which function can you use to replace NAs from your data set?
CorrectIncorrect -
Question 1337 of 1443
1337. Question
1. Fill in the blank below.
-
The 'gg' in ggplot2 stands for .
CorrectIncorrect -
-
Question 1338 of 1443
1338. Question
3. Which function creates a new layer with statistical smoothing of the plot?
CorrectIncorrect -
Question 1339 of 1443
1339. Question
2. Why do we change the scale of the axes to a logarithmic scale?
CorrectIncorrect -
Question 1340 of 1443
1340. Question
3. What does it mean when there is a high positive correlation between two attributes?
CorrectIncorrect -
Question 1341 of 1443
1341. Question
3. What could result from people in your network having more ties?
CorrectIncorrect -
Question 1342 of 1443
1342. Question
3. When a volcano erupted in Europe in 2010, where did IBM foresee a bottleneck in shipping?
CorrectIncorrect -
Question 1343 of 1443
1343. Question
3. Ensemble learning, a concept in machine learning, happens when a group of learners are used together to arrive at a more accurate decision. Based on this concept, which Yelp! review would you consider when deciding whether or not to dine at a restaurant?
CorrectIncorrect -
Question 1344 of 1443
1344. Question
3. Sets of variables are provided. Identify whether the set is most likely an example of correlation or causation.
Sort elements
- Causation
- Correlation
- Correlation
- Correlation
- Causation
- Causation
-
Number of school hours missed and student achievement
-
Number of fire trucks dispatched and amount of property damage
-
Amount of money spent each week on vegetables and changes in weight
-
Number of purchases of rain boots and percent of delayed flights
CorrectIncorrect -
Question 1345 of 1443
1345. Question
3. Put the steps in order that we took to visualize flights.
-
Graph it with the igraph package, both by frequency and just by route.
-
Tally up the number of flight paths.
-
Create unique IDs for flight paths between cities.
CorrectIncorrect -
-
Question 1346 of 1443
1346. Question
3. How can you determine if the histogram of your residuals is really a normal, unbiased distribution?
CorrectIncorrect -
Question 1347 of 1443
1347. Question
2. What are some things you should always check for in your model?
Select all that applyCorrectIncorrect -
Question 1348 of 1443
1348. Question
2. Fill in the blank below.
-
The objective of a model is not to perfectly fit data you already have, it's to have the highest predictive rate on new data.
CorrectIncorrect -
-
Question 1349 of 1443
1349. Question
3. Which connectors spread the most information to the rest of a network?
CorrectIncorrect -
Question 1350 of 1443
1350. Question
3. Put the functions of a business in the correct order.
-
R&D - Optimize design and decrease time
-
Sell - Target clients and suggest products
-
Buy - Manage inventory
-
Make - Ensure quality and gauge demand
-
Ship - Optimize route
CorrectIncorrect -
-
Question 1351 of 1443
1351. Question
Sort elements
- sum of the weights of the links inside community C
- sum of the weights of the links to nodes in community C
- sum of the weights of the links to the given node v
- sum of the weights of the links from the given node v to the community C
- sum of the weights of all the links in the network
-
Li
-
Lo
-
Lv
-
LC
-
Ls
CorrectIncorrect -
Question 1352 of 1443
1352. Question
3. Please fill in the blank below:
-
After injecting the patient, remove the from the syringe.
CorrectIncorrect -
-
Question 1353 of 1443
1353. Question
4. Fill in the blank below.
-
A big strength of ggplot is the ability to graphs by adding layers and adjusting the data so it doesn't look generic.
CorrectIncorrect -
-
Question 1354 of 1443
1354. Question
5. Good coding habits include:
Select all that applyCorrectIncorrect -
Question 1355 of 1443
1355. Question
4. Which type of data would the Sankey layout visualize best?
CorrectIncorrect -
Question 1356 of 1443
1356. Question
4. What are some conclusions from the visualization of Congress?
CorrectIncorrect -
Question 1357 of 1443
1357. Question
Fill in the blank below.
-
3. While Big Data is a resource, is the analysis that will draw insights from the data.
CorrectIncorrect -
-
Question 1358 of 1443
1358. Question
5. Google's search function is based on a scoring algorithm called PageRank. PageRank determines a website's importance by the number of important pages linked to it. Use the website's links to rank the websites according to their importance. Put the most important website at top.
-
A website with Scientific America, US Weekly, and MTV linked to it
-
A website with Pete's Coffee, Corner Bakery, and Dutch Brother's Coffee linked to it
-
A website with the New York Times, Facebook, and Apple linked to it
-
A website with your Etsy and Instagram accounts linked to it
CorrectIncorrect -
-
Question 1359 of 1443
1359. Question
4. Order the steps a data scientist takes when working on a project. Put the first step on top.
-
Communicate the results via visualizations, presentations, and products
-
Wrangle the data (gather, clean, and sample)
-
Confirm cause and effect relationships
-
Understand the business problem
-
Explore data to identify trends
-
Make predictions about events and behaviors
CorrectIncorrect -
-
Question 1360 of 1443
1360. Question
4. Analysis techniques need to provide a measurable benefit greater than the cost of data storage and management.
CorrectIncorrect -
Question 1361 of 1443
1361. Question
4. Fill in the blank below.
-
Some classification algorithms can go beyond determining whether someone will buy your product or not, they can quantify it by telling you the that someone will buy your product.
CorrectIncorrect -
-
Question 1362 of 1443
1362. Question
4. What methods can you use for datafication?
Select all that applyCorrectIncorrect -
Question 1363 of 1443
1363. Question
4. What do networks represent?
Select all that applyCorrectIncorrect -
Question 1364 of 1443
1364. Question
5. What are some caveats to keep in mind when working with network metrics?
Select all that applyCorrectIncorrect -
Question 1365 of 1443
1365. Question
4. What are some ways to fix multicollinearity?
Select all that applyCorrectIncorrect -
Question 1366 of 1443
1366. Question
4. Put the equations in order that you need to use for calculating multiplicative seasonality forecasts
-
level1 = alpha * (forecast1 / seasonality-4) + (1 – alpha ) * (level0 + trend0)
-
seasonality1 = gamma * (forecast1 / level1) + (1 - gamma) * seasonality-4
-
forecast1 = (level0 + trend0) * seasonality-4
-
trend1 = beta * (level1 – level0) + (1 - beta) * trend0
CorrectIncorrect -
-
Question 1367 of 1443
1367. Question
4. Why is calculating betweenness centrality important?
Select all that applyCorrectIncorrect -
Question 1368 of 1443
1368. Question
3. Why is it important to set the x-axis and y-axis limits?
CorrectIncorrect -
Question 1369 of 1443
1369. Question
4. Which of the statements below are true for calculating modularity?
Select all that applyCorrectIncorrect -
Question 1370 of 1443
1370. Question
4. Fill in the blank below.
-
While it may look like a scatter plot, a maps a third variable to the size of its points.
CorrectIncorrect -
-
Question 1371 of 1443
1371. Question
5. What types of data are mapped in the aes() function?
Select all that applyCorrectIncorrect -
Question 1372 of 1443
1372. Question
5. Which of these statements is true?
CorrectIncorrect -
Question 1373 of 1443
1373. Question
5. Which of these questions should you ask for classification?
Select all that applyCorrectIncorrect -
Question 1374 of 1443
1374. Question
5. Which picture below displays the standard error of a best fit line?
CorrectIncorrect -
Question 1375 of 1443
1375. Question
5. What is important to keep in mind when working with large amounts of network data?
Select all that applyCorrectIncorrect -
Question 1376 of 1443
1376. Question
5. Which function calculates and visualizes the communities in a network?
CorrectIncorrect -
Question 1377 of 1443
1377. Question
5. Which function calls up all the files in a folder for an overview?
CorrectIncorrect -
Question 1378 of 1443
1378. Question
Fill in the blank below.
-
Clustering and data mining are types of data analysis , which is a type of data analysis where the intent is to see what the data can tell us beyond modeling or hypothesis testing.
CorrectIncorrect -
-
Question 1379 of 1443
1379. Question
Match the following terms to the correct definition:
Sort elements
- Pulls rows where the value of the joining field is present in both tables
- Pulls all rows from one table, and only the rows from the second table where the value of the joining field matches a value.
- Pulls all rows from both tables.
- Pulls all possible combinations of rows in all tables.
-
INNER JOIN
-
(LEFT or RIGHT) OUTER JOIN
-
FULL OUTER JOIN
-
CROSS JOIN
CorrectIncorrect -
Question 1380 of 1443
1380. Question
Fill in the blank below.
-
can have a very negative impact on linear regressions if they are not identified and handled properly because they can skew the algorithm. It's important to identify them early and determine why they do not conform to the majority of the data points in case you need to adjust your model. You can identify them with Cook's distance or boxplots.
CorrectIncorrect -
-
Question 1381 of 1443
1381. Question
Fill in the blank below:
-
In entropy, the number indicates 100% of the data is the same, and the number indicates a 50-50 split.
CorrectIncorrect -
-
Question 1382 of 1443
1382. Question
Which of the following SQL functions can be used on date fields?
Select all that applyCorrectIncorrect -
Question 1383 of 1443
1383. Question
Which type of data contain sets of categories?
CorrectIncorrect -
Question 1384 of 1443
1384. Question
Match the function names to their descriptions.
Sort elements
- labs()
- coord_flip()
- facet_wrap()
- geom_area()
-
Sets labels for axes and title
-
Flips the axes of a graph
-
Splits up data by category to give smaller individual graphs
-
Creates an area plot
CorrectIncorrect -
Question 1385 of 1443
1385. Question
In a non-biased model errors will be random. If errors are not random it means...
Select all that applyCorrectIncorrect -
Question 1386 of 1443
1386. Question
Sort the variables as either continuous or discrete.
Sort elements
- Number of cars, number of buildings, temperature
- Days of the week, months of the year
- Colors, types of weather, names
-
Continuous variables
-
Discrete variables
-
Discrete variables without a defined sequence
CorrectIncorrect -
Question 1387 of 1443
1387. Question
Put the 5 functions of an organization in order.
-
Procurement
-
Sales
-
Research and development
-
Shipment
-
Production
CorrectIncorrect -
-
Question 1388 of 1443
1388. Question
Fill in the blank below.
-
can have a very negative impact on linear regressions if they are not identified and handled properly, as they can skew the data because they lie outside the majority of data points.
CorrectIncorrect -
-
Question 1389 of 1443
1389. Question
How does clustering help when there are more than 3 attributes in the data?
CorrectIncorrect -
Question 1390 of 1443
1390. Question
Please fill in the blank below:
-
Remember, like all resources, - data that cannot fit on a single computer or server - has to be cost effective. This term does not refer to data analytics, although it sometimes conflated to mean the same thing.
CorrectIncorrect -
-
Question 1391 of 1443
1391. Question
Please fill in the blank below:
-
Naive Bayes makes the assumption that the variables are , which means that the presence of one variable does not affect the presence of another variable.
CorrectIncorrect -
-
Question 1392 of 1443
1392. Question
Please fill in the blank below.
-
In a relationship, the value of the dependent variable changes in a non-linear fashion, so we may need more than one coefficient to predict trends.
CorrectIncorrect -
-
Question 1393 of 1443
1393. Question
Please fill in the blank below.
-
Clustering assumes that is a measure for similarity. In other words, data points that are “closer” together are probably more similar than data points that are farther apart.
CorrectIncorrect -
-
Question 1394 of 1443
1394. Question
Match the definition of the type of linkage with the correct term.
Sort elements
- Minimum distance between points
- Maximum distance between points
- Group distance average
- Distance between centroids
-
Single linkage
-
Complete linkage
-
Average linkage
-
Centroid linkage
CorrectIncorrect -
Question 1395 of 1443
1395. Question
4. What is unsupervised machine learning?
CorrectIncorrect -
Question 1396 of 1443
1396. Question
What would be the output of the following code for vector 'v':
v[2:7]
CorrectIncorrect -
Question 1397 of 1443
1397. Question
What is one of the dangers of increasing the number of clusters?
CorrectIncorrect -
Question 1398 of 1443
1398. Question
You can use the predict() function to make predictions using the model that you developed. Put the prediction use cases below in order according to the business function it was used for.
-
Sell: Harrah's Hotel and Casino in Las Vegas predicts how much a customer will spend over the years, estimating their lifetime value to the casino
-
Buy: Ski manufacturers predict demand for skis each winter, stocking up on supplies
-
R&D: As much as 40% of trading on the London Stock Exchange is estimated to be driven by trading algorithms
-
Ship: Energex (Australian utility) predicts 20 years of electricity demand growth to direct infrastructure investment
-
Make: Life insurance companies predict the age of death in order to approve policies and set pricing
CorrectIncorrect -
-
Question 1399 of 1443
1399. Question
Which function adds up the data in the previous cells to create a new column or row with cumulative sums?
CorrectIncorrect -
Question 1400 of 1443
1400. Question
What is unsupervised machine learning?
CorrectIncorrect -
Question 1401 of 1443
1401. Question
Which two variables showed the strongest correlations with two clusters?
Select all that applyCorrectIncorrect -
Question 1402 of 1443
1402. Question
Data science is at the intersection of three domains:
CorrectIncorrect -
Question 1403 of 1443
1403. Question
1. Fill in the blank below.
-
is a term that means only looking at a portion of the data. It is denoted in R by a '$' symbol.
CorrectIncorrect -
-
Question 1404 of 1443
1404. Question
1. Match the functions to the actions that they perform in R.
Sort elements
- sets up the network data
- checks the structure of the output
- pull attributes of graph vertices
- pulls attributes of graph edges
-
graph.data.frame()
-
str()
-
V()
-
E()
CorrectIncorrect -
Question 1405 of 1443
1405. Question
1. Match the functions to the actions that they perform in R.
Sort elements
- sets up the network data
- checks the structure of the output
- pull attributes of graph vertices
- pulls attributes of graph edges
-
graph.data.frame()
-
str()
-
V()
-
E()
CorrectIncorrect -
Question 1406 of 1443
1406. Question
1. When running a variable selection model, how does the computer know when it has found the right variables?
CorrectIncorrect -
Question 1407 of 1443
1407. Question
1. Fill in the blanks below.
-
You always have to your models and check for potential even before you can test it on new data!
CorrectIncorrect -
-
Question 1408 of 1443
1408. Question
2. Which type of data contain sets of categories?
CorrectIncorrect -
Question 1409 of 1443
1409. Question
2. Fill in the blank below.
-
To make sure your images are reproducible, you can use the function.
CorrectIncorrect -
-
Question 1410 of 1443
1410. Question
2. Fill in the blank below.
-
To make sure your images are reproducible, you can use the function.
CorrectIncorrect -
-
Question 1411 of 1443
1411. Question
2. What are some things you should always check for in your model?
CorrectIncorrect -
Question 1412 of 1443
1412. Question
2. What does the Akaike Information Criterion (AIC) do?
CorrectIncorrect -
Question 1413 of 1443
1413. Question
3. How can you check the warnings to see if there is anything you should be concerned about?
CorrectIncorrect -
Question 1414 of 1443
1414. Question
3. How can you check the warnings to see if there is anything you should be concerned about?
CorrectIncorrect -
Question 1415 of 1443
1415. Question
3. Match the function to its purpose.
Sort elements
- searches for text in data
- gives you the length of any vector
- tabulates the number of entries for categorical data
- sorts data by a particular column
-
grep()
-
length()
-
table()
-
order()
CorrectIncorrect -
Question 1416 of 1443
1416. Question
3. What are some key things you should always check for in your model?
CorrectIncorrect -
Question 1417 of 1443
1417. Question
3. What is a good way to test for multicollinearity?
CorrectIncorrect -
Question 1418 of 1443
1418. Question
3. What is heteroscedasticity?
CorrectIncorrect -
Question 1419 of 1443
1419. Question
4. After running a Breusch-Pagan test, how would I know that there is no heteroscedasticity?
CorrectIncorrect -
Question 1420 of 1443
1420. Question
CorrectIncorrect -
Question 1421 of 1443
1421. Question
4. What type of data does the grep() function work with?
CorrectIncorrect -
Question 1422 of 1443
1422. Question
4. Which package do we use to run the vif() function?
CorrectIncorrect -
Question 1423 of 1443
1423. Question
4. You can use the predict() function to make predictions using the model that you developed. Put the prediction use cases below in order according to the business function it was used for.
-
Buy: Ski manufacturers predict demand for skis each winter, stocking up on supplies
-
Make: Life insurance companies predict the age of death in order to approve policies and set pricing
-
Sell: Harrah's Hotel and Casino in Las Vegas predicts how much a customer will spend over the years, estimating their lifetime value to the casino
-
R&D: As much as 40% of trading on the London Stock Exchange is estimated to be driven by trading algorithms
-
Ship: Energex (Australian utility) predicts 20 years of electricity demand growth to direct infrastructure investment
CorrectIncorrect -
-
Question 1424 of 1443
1424. Question
5. Match the key terms below to their descriptions.
Sort elements
- Check if there is bias in the data or the model
- The probability that the pattern exists through random chance
- Test for multicollinearity and independent variable interaction
- Check the residuals for heteroscedasticity (pattern contingent on fitted values)
- Check for information loss when selecting the right model for your data
-
Q-Q plot/ distribution of errors
-
p-values
-
VIF
-
Breusch-Pagan test
-
AIC
CorrectIncorrect -
Question 1425 of 1443
1425. Question
5. Match the methods of variable selection to the correct descriptions.
Sort elements
- Algorithm starts with a model of 0 variables and continues to add more variables based upon a specified measure
- Starts with a model of all variables, and removes variables based upon a specified measure
- Combination of forward and backward selection that starts with a model of 0 variables and adds variables, but can also remove variables based upon a specified measure
-
Forward selection
-
Backward selection
-
Step-wise selection
CorrectIncorrect -
Question 1426 of 1443
1426. Question
CorrectIncorrect -
Question 1427 of 1443
1427. Question
5. Which function eliminates duplicate rows?
CorrectIncorrect -
Question 1428 of 1443
1428. Question
5. Which one of these is not a component of a needle?
CorrectIncorrect -
Question 1429 of 1443
1429. Question
5. Which package should you install to plot an interactive network visualization?
CorrectIncorrect -
Question 1430 of 1443
1430. Question
5. Which package should you install to plot an interactive network visualization?
CorrectIncorrect -
Question 1431 of 1443
1431. Question
Fill in the blank below.
-
A good explanatory model will have residuals whose variance does not depend on the (predictor) variables.
CorrectIncorrect -
-
Question 1432 of 1443
1432. Question
Fill in the blank below.
-
can have a very negative impact on linear regressions if they are not identified and handled properly, as they can skew the data because they lie outside the majority of data points.
CorrectIncorrect -
-
Question 1433 of 1443
1433. Question
What are some important questions you have to ask in order to be comfortable with your model?
Select all that applyCorrectIncorrect -
Question 1434 of 1443
1434. Question
What are some important things to remember when working with outliers in your data?
Select all that applyCorrectIncorrect -
Question 1435 of 1443
1435. Question
What are some ways you can identify outliers in your data?
Select all that applyCorrectIncorrect -
Question 1436 of 1443
1436. Question
What does it mean to “practice” coding?
CorrectIncorrect -
Question 1437 of 1443
1437. Question
What is supervised machine learning?
CorrectIncorrect -
Question 1438 of 1443
1438. Question
What is unsupervised machine learning?
CorrectIncorrect -
Question 1439 of 1443
1439. Question
Which of these is an example of exploratory data analysis?
CorrectIncorrect -
Question 1440 of 1443
1440. Question
Why do we need to validate the model?
CorrectIncorrect -
Question 1441 of 1443
1441. Question
Put the six Data Science control cycle steps in order, starting with “Ask”
-
Interpret
-
Test
-
Ask
-
Validate
-
Model
-
Research
CorrectIncorrect -
-
Question 1442 of 1443
1442. Question
CorrectIncorrect -
Question 1443 of 1443
1443. Question
4. What method do you use to recap a needle?
 CorrectIncorrect

