Concept review 7: basic plotting
Test your understanding with this five question quiz!
Quiz Summary
0 of 5 questions completed
Questions:
Information
You have already completed the quiz before. Hence you can not start it again.
Quiz is loading…
You must sign in or sign up to start the quiz.
You must first complete the following:
Results
Results
0 of 5 questions answered correctly
Your time:
Time has elapsed
You have reached 0 of 0 point(s), (0)
Earned Point(s): 0 of 0, (0)
0 Essay(s) Pending (Possible Point(s): 0)
Categories
- Not categorized 0%
- 1
- 2
- 3
- 4
- 5
- Current
- Review
- Answered
- Correct
- Incorrect
-
Question 1 of 5
1. Question
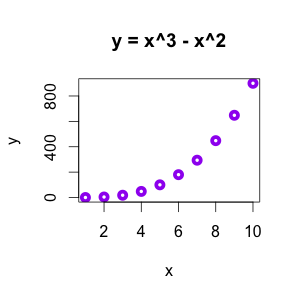
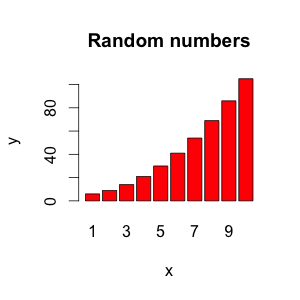
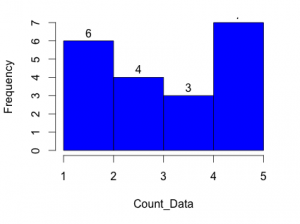
1. Match the names to the graphs below.
Sort elements
- Scatter plot
- Line graph
- Bar graph
- Histogram
CorrectIncorrect -
Question 2 of 5
2. Question
2. Fill in the blank below.
-
R is a powerful tool for because the graphics tie in with the functions used to analyze data
CorrectIncorrect -
-
Question 3 of 5
3. Question
3. Why might bar graphs be misleading?
CorrectIncorrect -
Question 4 of 5
4. Question
4. Visualization is an iterative process. Put the steps in order starting with “Analyze”
-
Manipulate
-
Repeat
-
Analyze
-
Graph
CorrectIncorrect -
-
Question 5 of 5
5. Question
5. Why do we build visualizations?
CorrectIncorrect


